XRP saw a small increase of around 0.50% over the past week and it currently trades at $0.2935. The cryptocurrency struggles to break above the resistance at $0.30 and looks ready to roll-over and fall lower. Whilst the majority of the top-10 projects surged this week by between 13% and 30%, XRP lags behind after increasing by just 6%.
Nevertheless, XRP remains the third-largest cryptocurrency with a market cap of $12.74 billion.
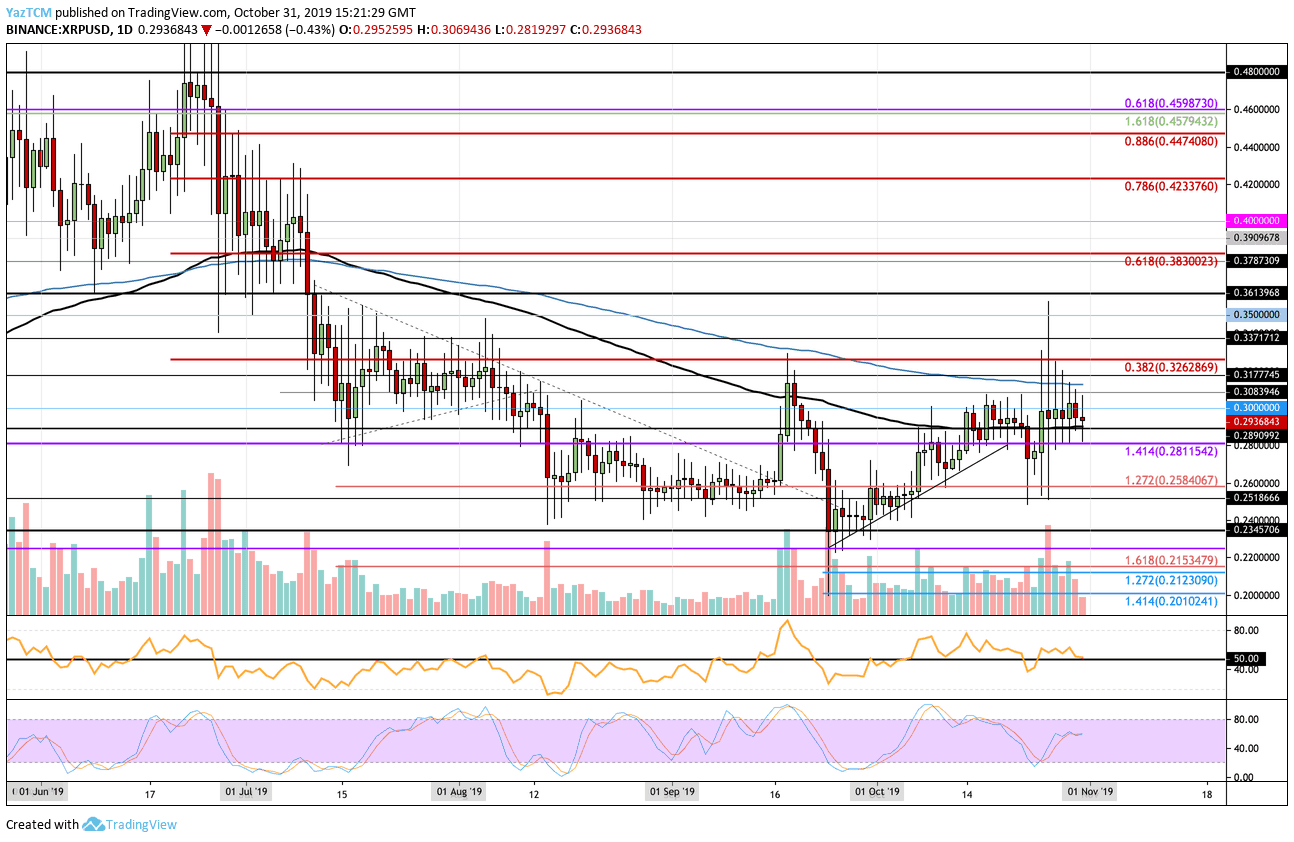
Looking at the XRP/USD 1-Day Chart:
- Since our previous XRP/USD analysis, the cryptocurrency proceeded to trade sideways, not being able to close any day above the $0.30 resistance level. It managed to climb as high as $0.31 but closed each candle below $0.30.
- From above: The nearest level of resistance lies at $0.30. Above this, resistance lies at $0.313 which is bolstered by the 200-days EMA. If the buyers can push the price above this level, we can expect higher resistance at $0.3177, $0.3262 (bearish .382 Fib Retracement), $0.3371, and $0.35.
- From below: The nearest level of support lies at $0.2890 which is provided by the 100-days EMA. Beneath this, support can be expected at $0.2811, $0.27, $0.2584, and $0.25.
- The trading volume is quite high but is starting to diminish over the past 3 days.
- The RSI is trading directly along with the 50 level, showing neither the bulls nor the bears are in control over the market momentum. It looks like it might penetrate beneath which will result in a breakdown beneath $0.29.
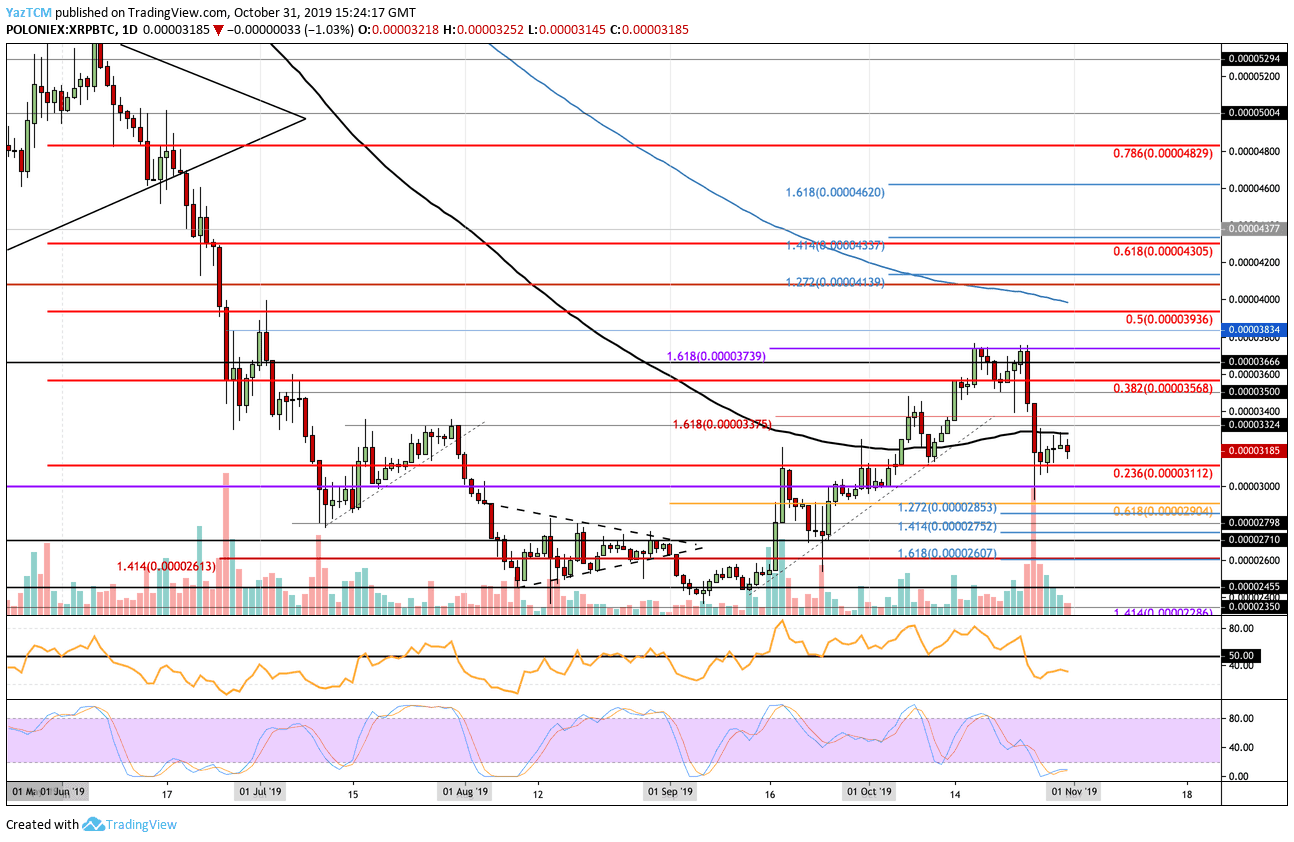
Looking at the XRP/BTC 1-Day Chart:
- Against Bitcoin, XRP was unable to climb above the resistance at the 100-days EMA at around 3300 SAT but remained supported by the 3112 SAT level.
- From above: The nearest resistance lies at the 100-days EMA at 3300 SAT. Above this, resistance is found at 3500 SAT, 3568 SAT, 3666 SAT, 3739 SAT (October 2019 high), 3834 SAT, 3936 SAT, and 4000 SAT.
- From below: The nearest level of support is located at 3112 SAT. Beneath this, support lies at 3000 SAT, 2904 SAT, 2852 SAT (downside 1.272 Fib Extension), 2752 SAT (downside 1.414 Fib Extension), 2710 SAT, and 2600 SAT.
- The trading volume has been trailing lower toward the end of October.
- The RSI is beneath the 50 level which shows that the sellers control the market momentum. However, the Stochastic RSI is primed for a bullish crossover signal in extremely oversold territory which should see the market heading higher.
SPECIAL OFFER (Sponsored)
LIMITED OFFER 2024 for CryptoPotato readers at Bybit: Use this link to register and open a $500 BTC-USDT position on Bybit Exchange for free!
Disclaimer: Information found on CryptoPotato is those of writers quoted. It does not represent the opinions of CryptoPotato on whether to buy, sell, or hold any investments. You are advised to conduct your own research before making any investment decisions. Use provided information at your own risk. See Disclaimer for more information.
Cryptocurrency charts by TradingView.