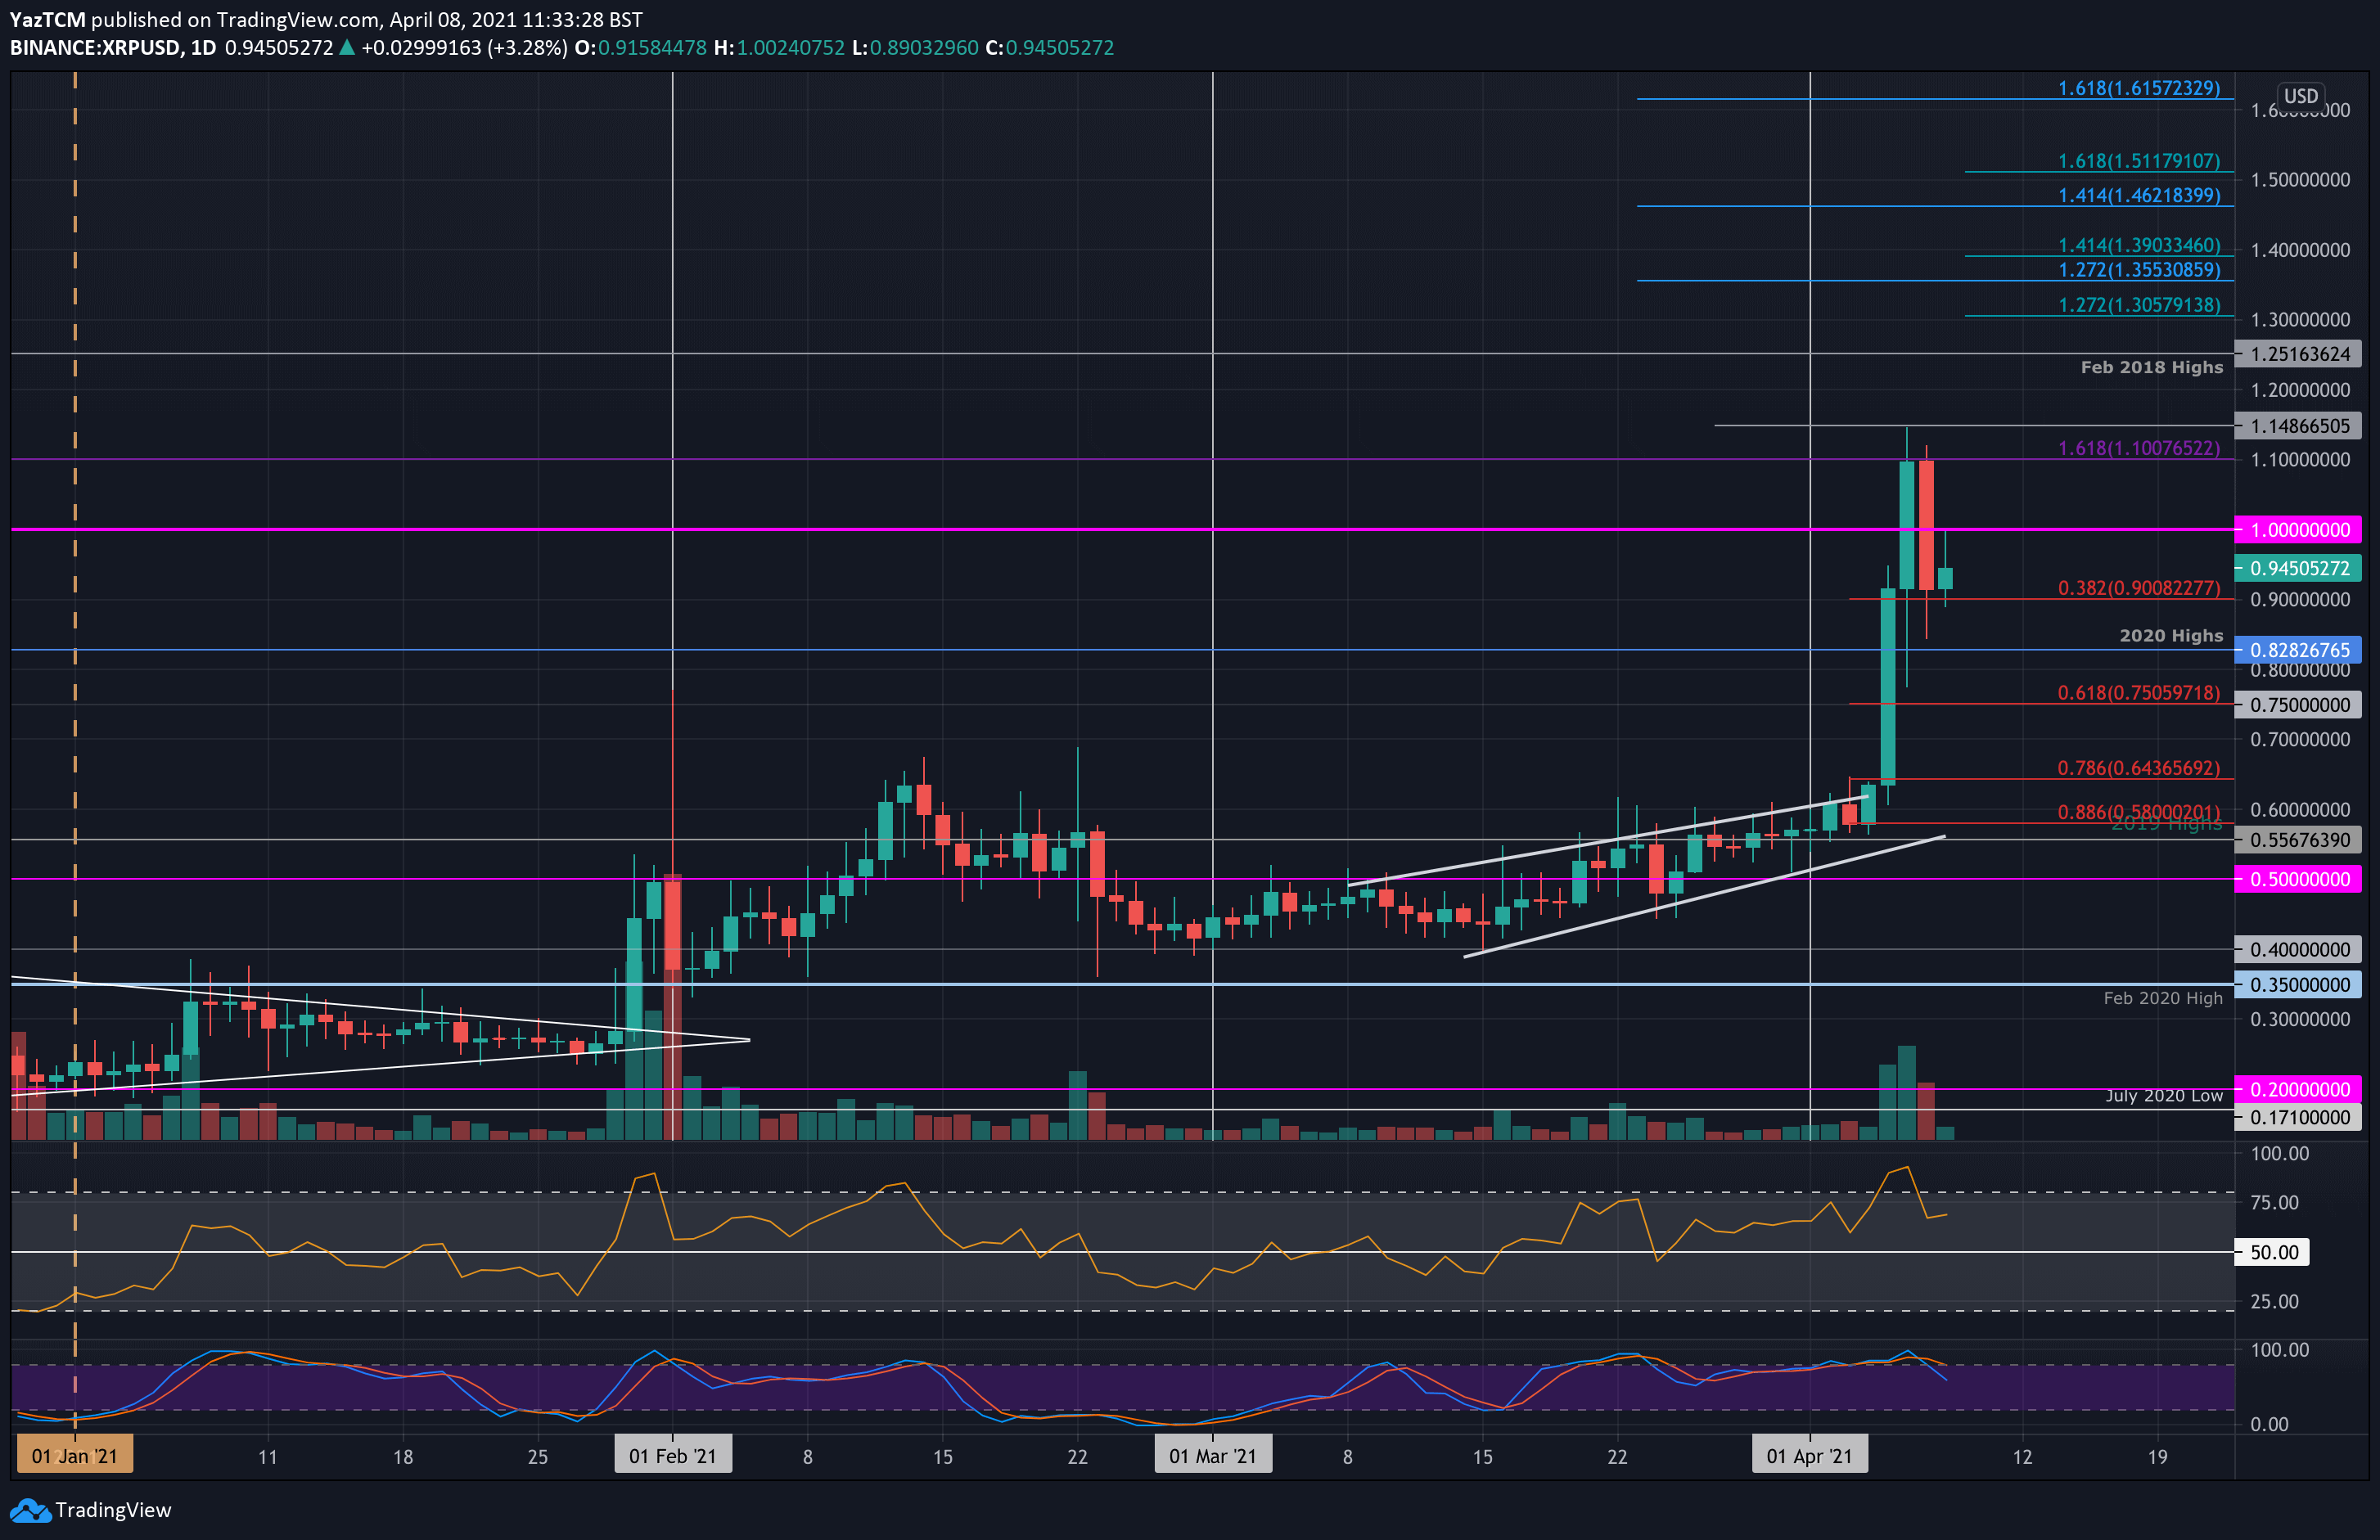
XRP/USD Daily Chart. Source: TradingView
Key Support Levels: $0.9, $0.828, $0.75.
Key Resistance Levels: $1.00, $1.10, $1.14.
XRP saw impressive growth over the past few days as it broke above $1 for the first time since March 2018 after a 65% weekly surge. The cryptocurrency penetrated above an ascending bullish wedge at the start of the week and exploded higher on Monday to reach $0.8.
The buyers continued and reached as high as $1.14. More specifically, they met resistance at $1.10 (1.618 Fib Extension) and could not close a daily candle above this level. It dropped lower from there yesterday to find support at $0.9 (.382 Fib).
It has since bounced from $0.9 today to trade around $0.95.
Looking ahead, the first resistance lies at $1.00. This is followed by $1.10 (1.618 Fib Extension), $1.14, and $1.25 (Feb 2018 Highs). Added resistance lies at $1.30 (1.272 Fib), $1.35, and $1.39 (1.414 Fib Extension).
On the other side, the first support lies at $0.9 (.382 Fib). This is followed by $0.828 (2020 highs & .5 Fib), $0.75 (.618 Fib), and $0.7.
The RSI is well within the bullish favor and had dropped from extremely overbought conditions, providing room for the bulls to push higher again before becoming exhausted.
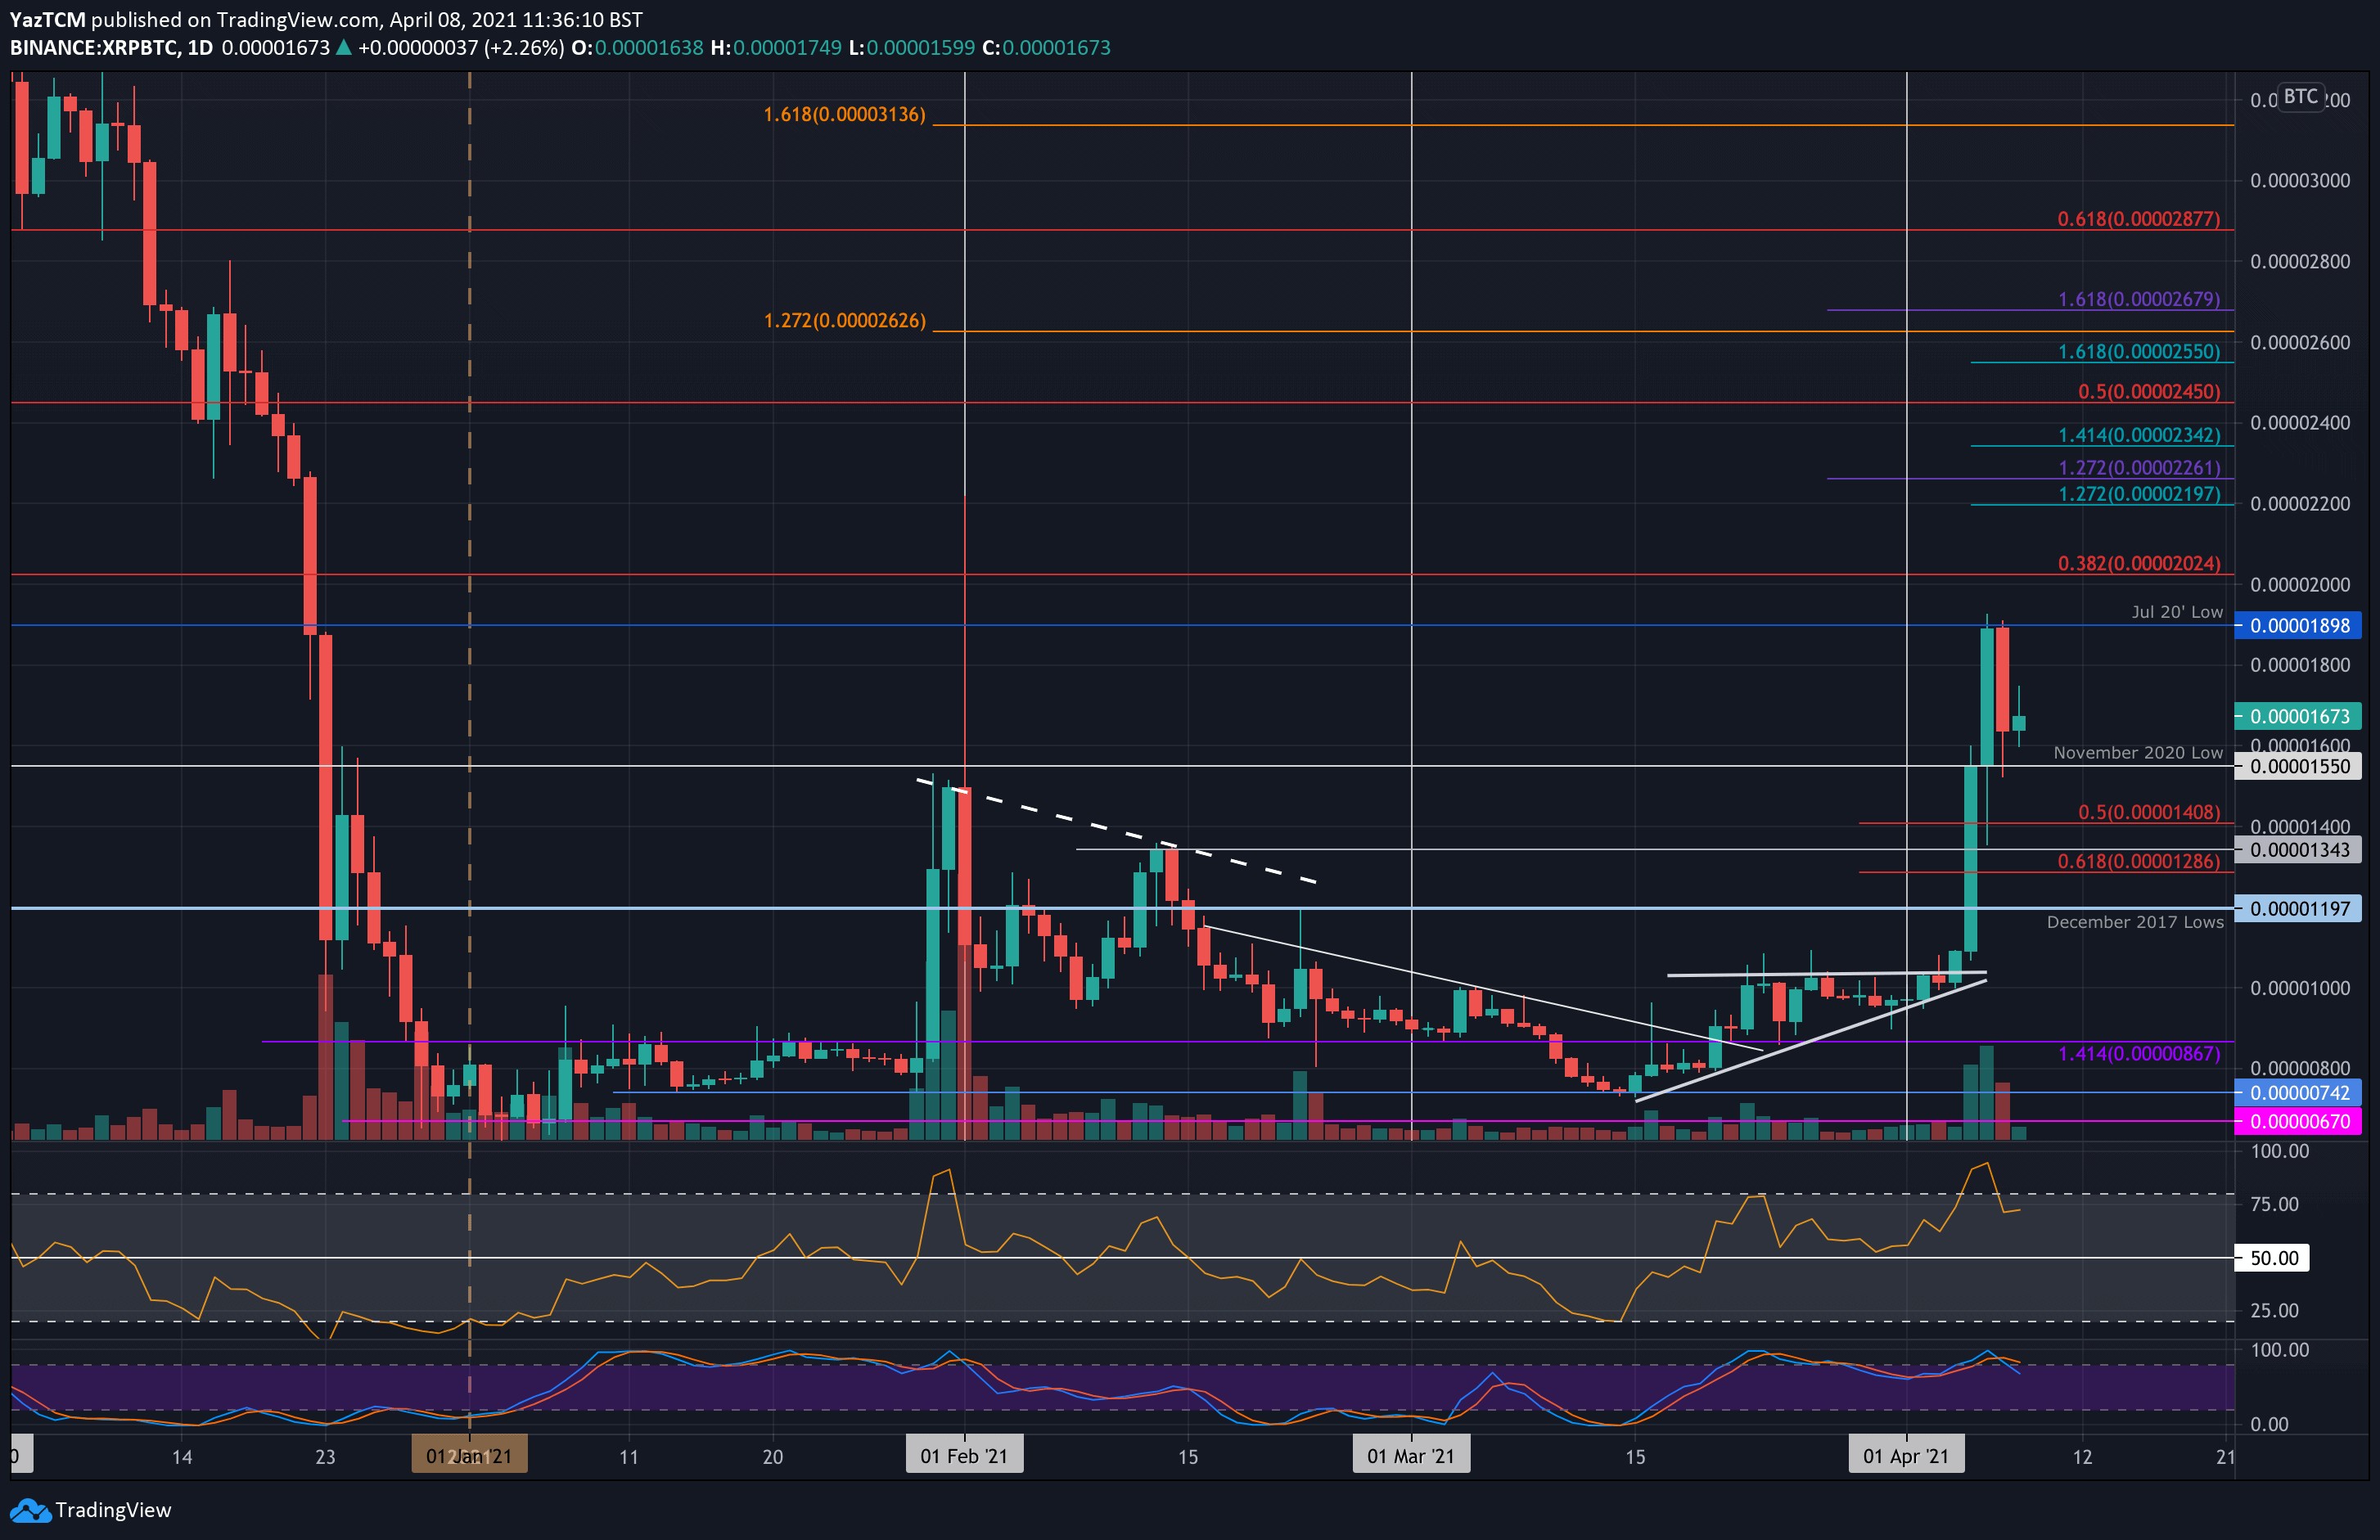
Key Support Levels: 1550 SAT, 1400 SAT, 1345 SAT.
Key Resistance Levels: 1900 SAT, 2000 SAT, 2200 SAT.
XRP is performing remarkably well against Bitcoin as well. The cryptocurrency started the week by breaking above an ascending triangle pattern. On Monday, the coin surged as high as the November 2020 lows at 1550 SAT and continued upward to 1900 SAT (July 2020 low) by Tuesday.
It was unable to close a daily candle above 1900 SAT and headed lower from there yesterday to reach the 1550 SAT support. It has since rebounded from there and is trading at 1670 SAT.
Looking ahead, the first resistance lies at 1900 SAT (July 2020 low). This is followed by 2000 SAT (bearish .382 Fib), 2200 SAT (1.272 Fib Extension), 2342 SAT (1.414 Fib Extension), and 2450 SAT (bearish .5 Fib).
On the other side, the first support lies at 1550 SAT (Nov 2020 low). This is followed by 1400 SAT (.5 Fib), 1345 SAT, 1285 SAT (.618 Fib), and 1200 SAT (Dec 2017 lows).
Likewise, the RSI has pulled back from extremely overbought conditions seen earlier in the week. This provides room for the bulls to push higher again before becoming exhausted again.