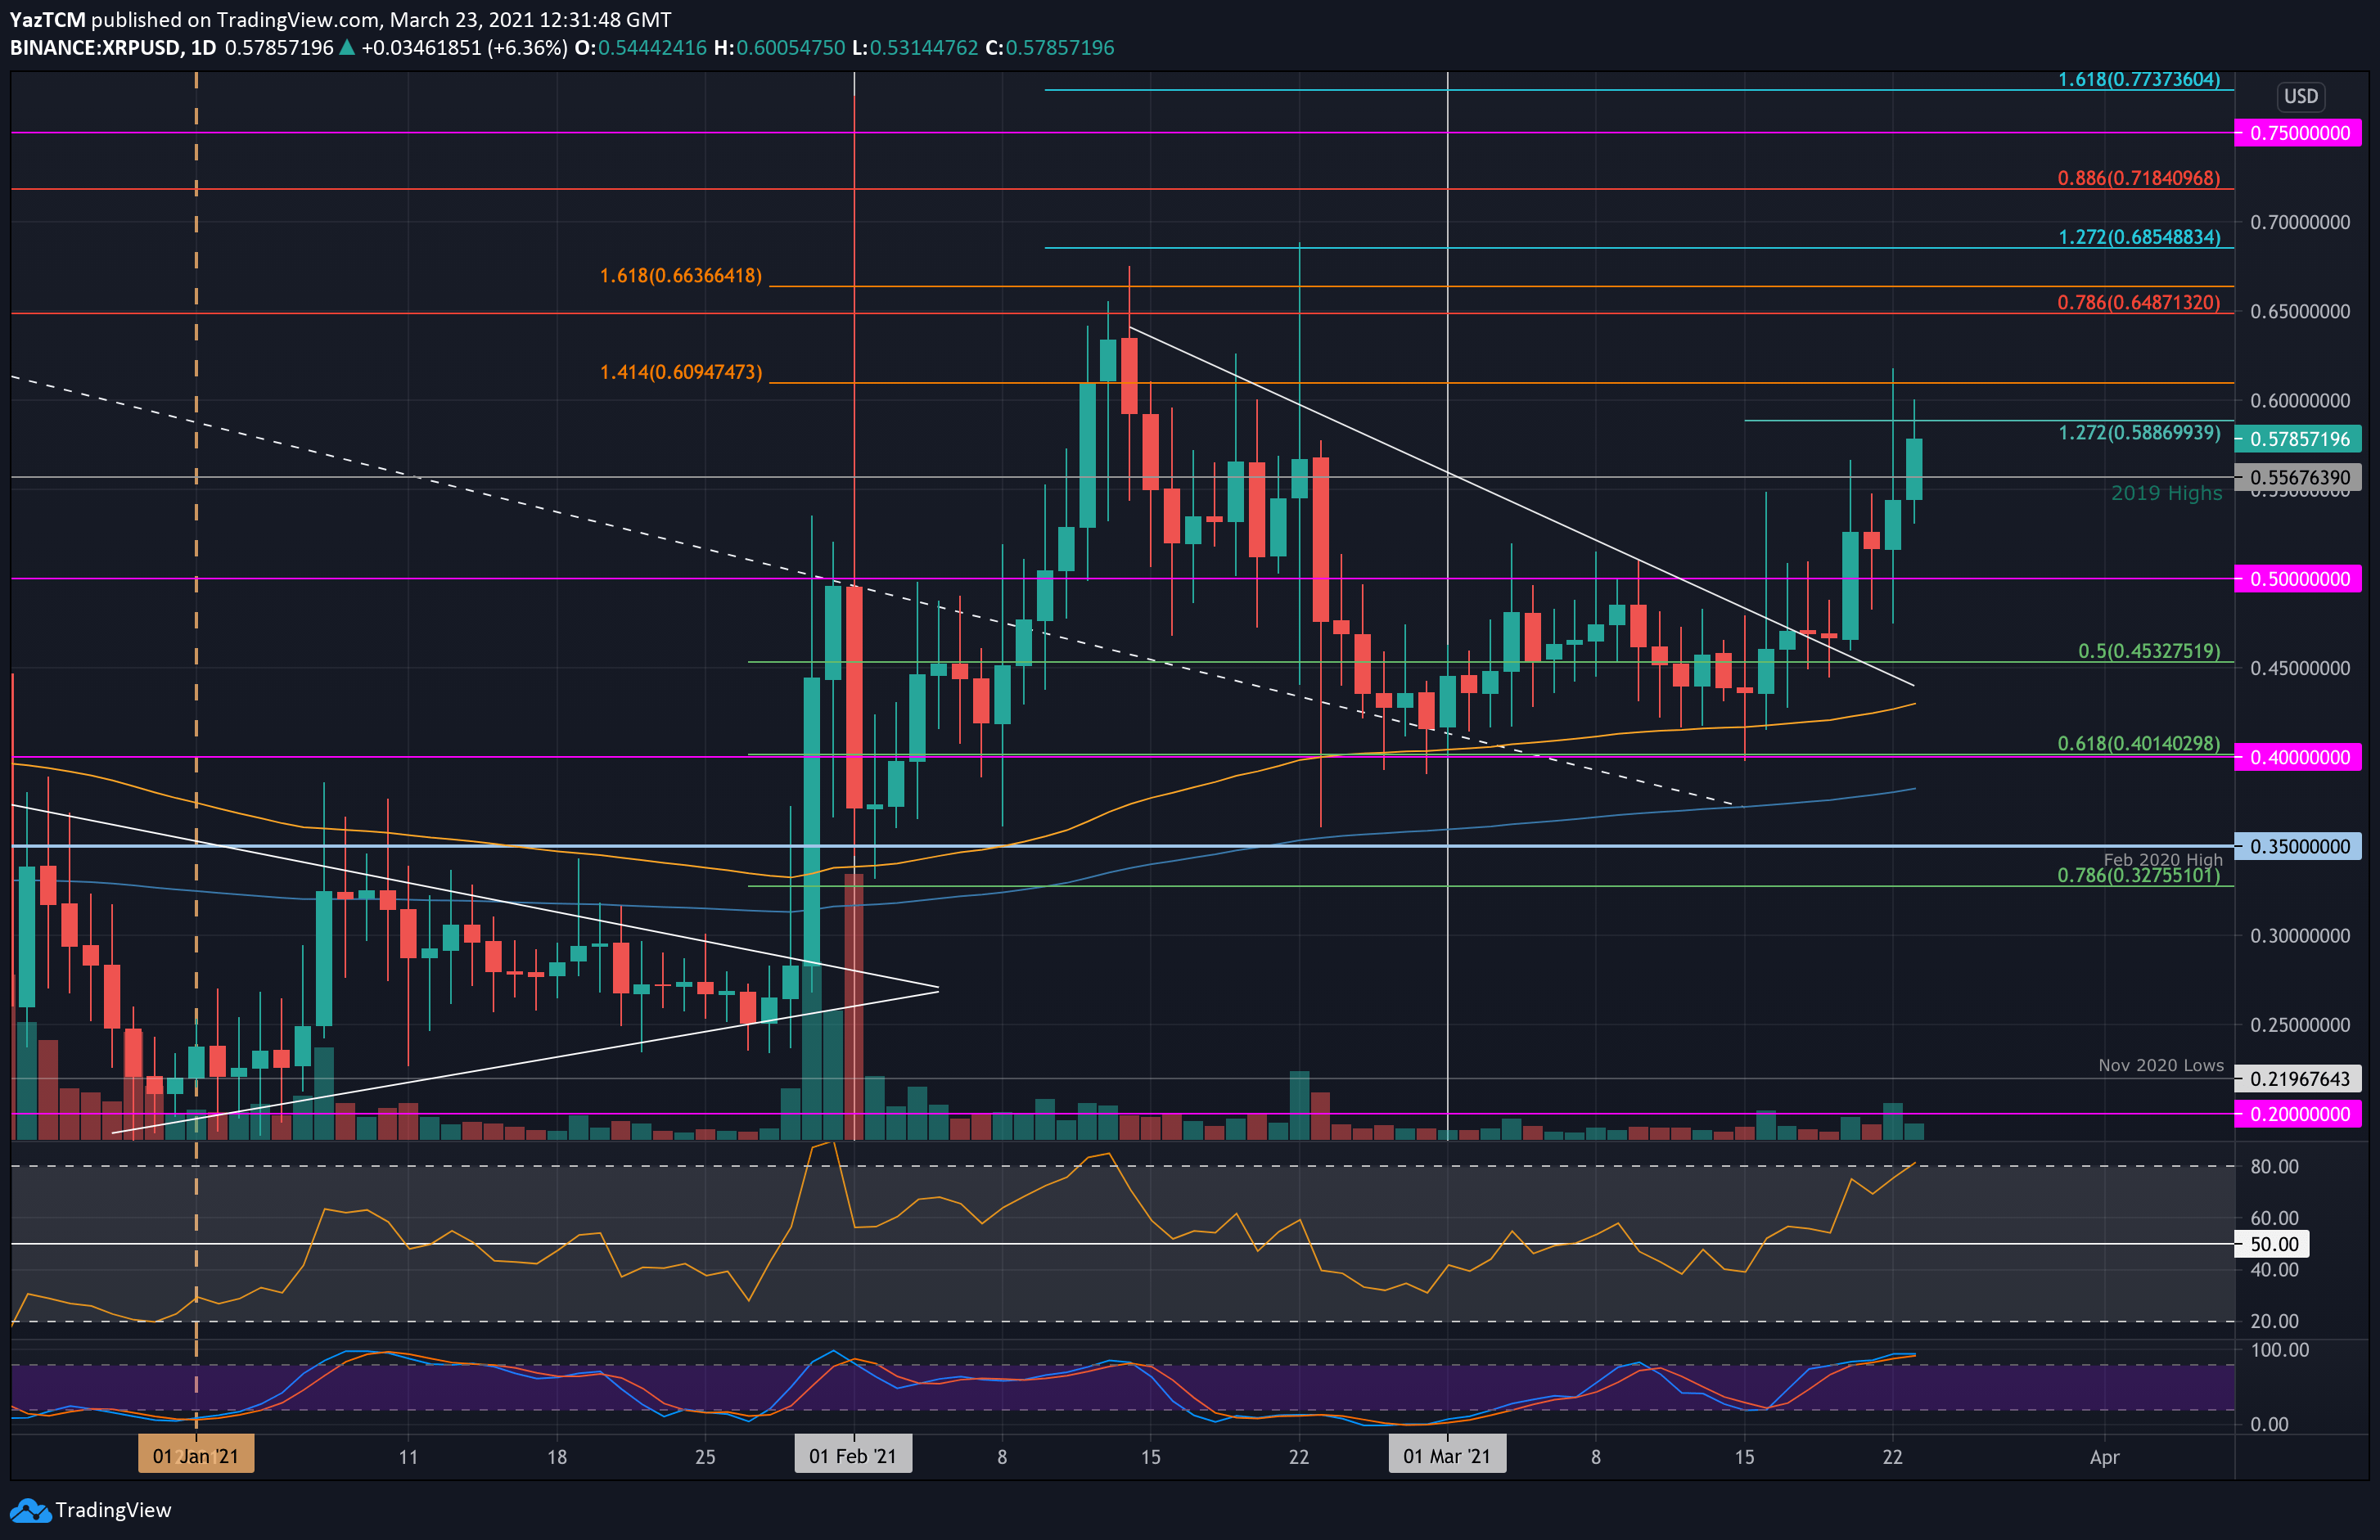
XRP/USD Daily Chart. Source: TradingView
Key Support Levels: $0.5, $0.453, $0.42.
Key Resistance Levels: $0.556, $0.588, $0.6.
XRP is in full recovery mode after surging by a total of 5.5% today to break the 2019 highs at $0.556 and reach $0.6. XRP is now up by a total of 30% this week, making it the second-highest performing top-10 ranked cryptocurrency behind Theta (+75%).
The cryptocurrency had penetrated above a falling wedge pattern over the weekend as it pushed to break resistance at $0.5. From there, XRP has been slowly grinding higher each day to break the 2019 highs and hit $0.6. It has since dropped to $0.578.
It’s worth noting that the most recent surge comes as result of somewhat positive developments in relation to the Ripple-SEC lawsuit.
Looking ahead, the first level of resistance lies $0.588 (short-term 1.272 Fib Extension). This is followed by $0.6, $0.65 (bearish .786 Fib Retracement), and $0.685 (1.272 Fib Extension & February highs).
On the other side, the first level of support lies at $0.556 (2019 Highs). This is followed by $0.5, $0.45 (.5 Fib Retracement), $0.425 (100-days EMA), and $0.4 (.618 Fib Retracement).
The daily RSI is fully in the bullish favor as it approaches extremely overbought conditions. However, the Stochastic RSI is already extremely overbought and is primed for a bearish crossover signal that might cause a correction within the market.
Key Support Levels: 800 SAT, 740 SAT, 670 SAT.
Key Resistance Levels: 867 SAT, 1000 SAT, 1200 SAT.
XRP penetrated above a descending trend line over the weekend as it pushed back above the January price range after penetrating 867 SAT. Prior to this, XRP created fresh 2-month lows as it slipped beneath 800 SAT to reach the support at 742 SAT where it finally rebounded.
Over the past two days, XRP moved higher to reach 1000 SAT and break above it today to reach 1050 SAT.
Moving forward, the first level of resistance lies at 1200 SAT (December 2017 lows & 100-days EMA). This is followed by 1345 SAT, 500 SAT (200-days EMA), and 1550 SAT (November 2020 Lows).
On the other side, the first level of support lies at 1000 SAT. This is followed by 900 SAT, 867 SAT, 800 SAT, and 742 SAT.
The RSI is also reaching overbought conditions here, indicating the bulls might be a little overextended.