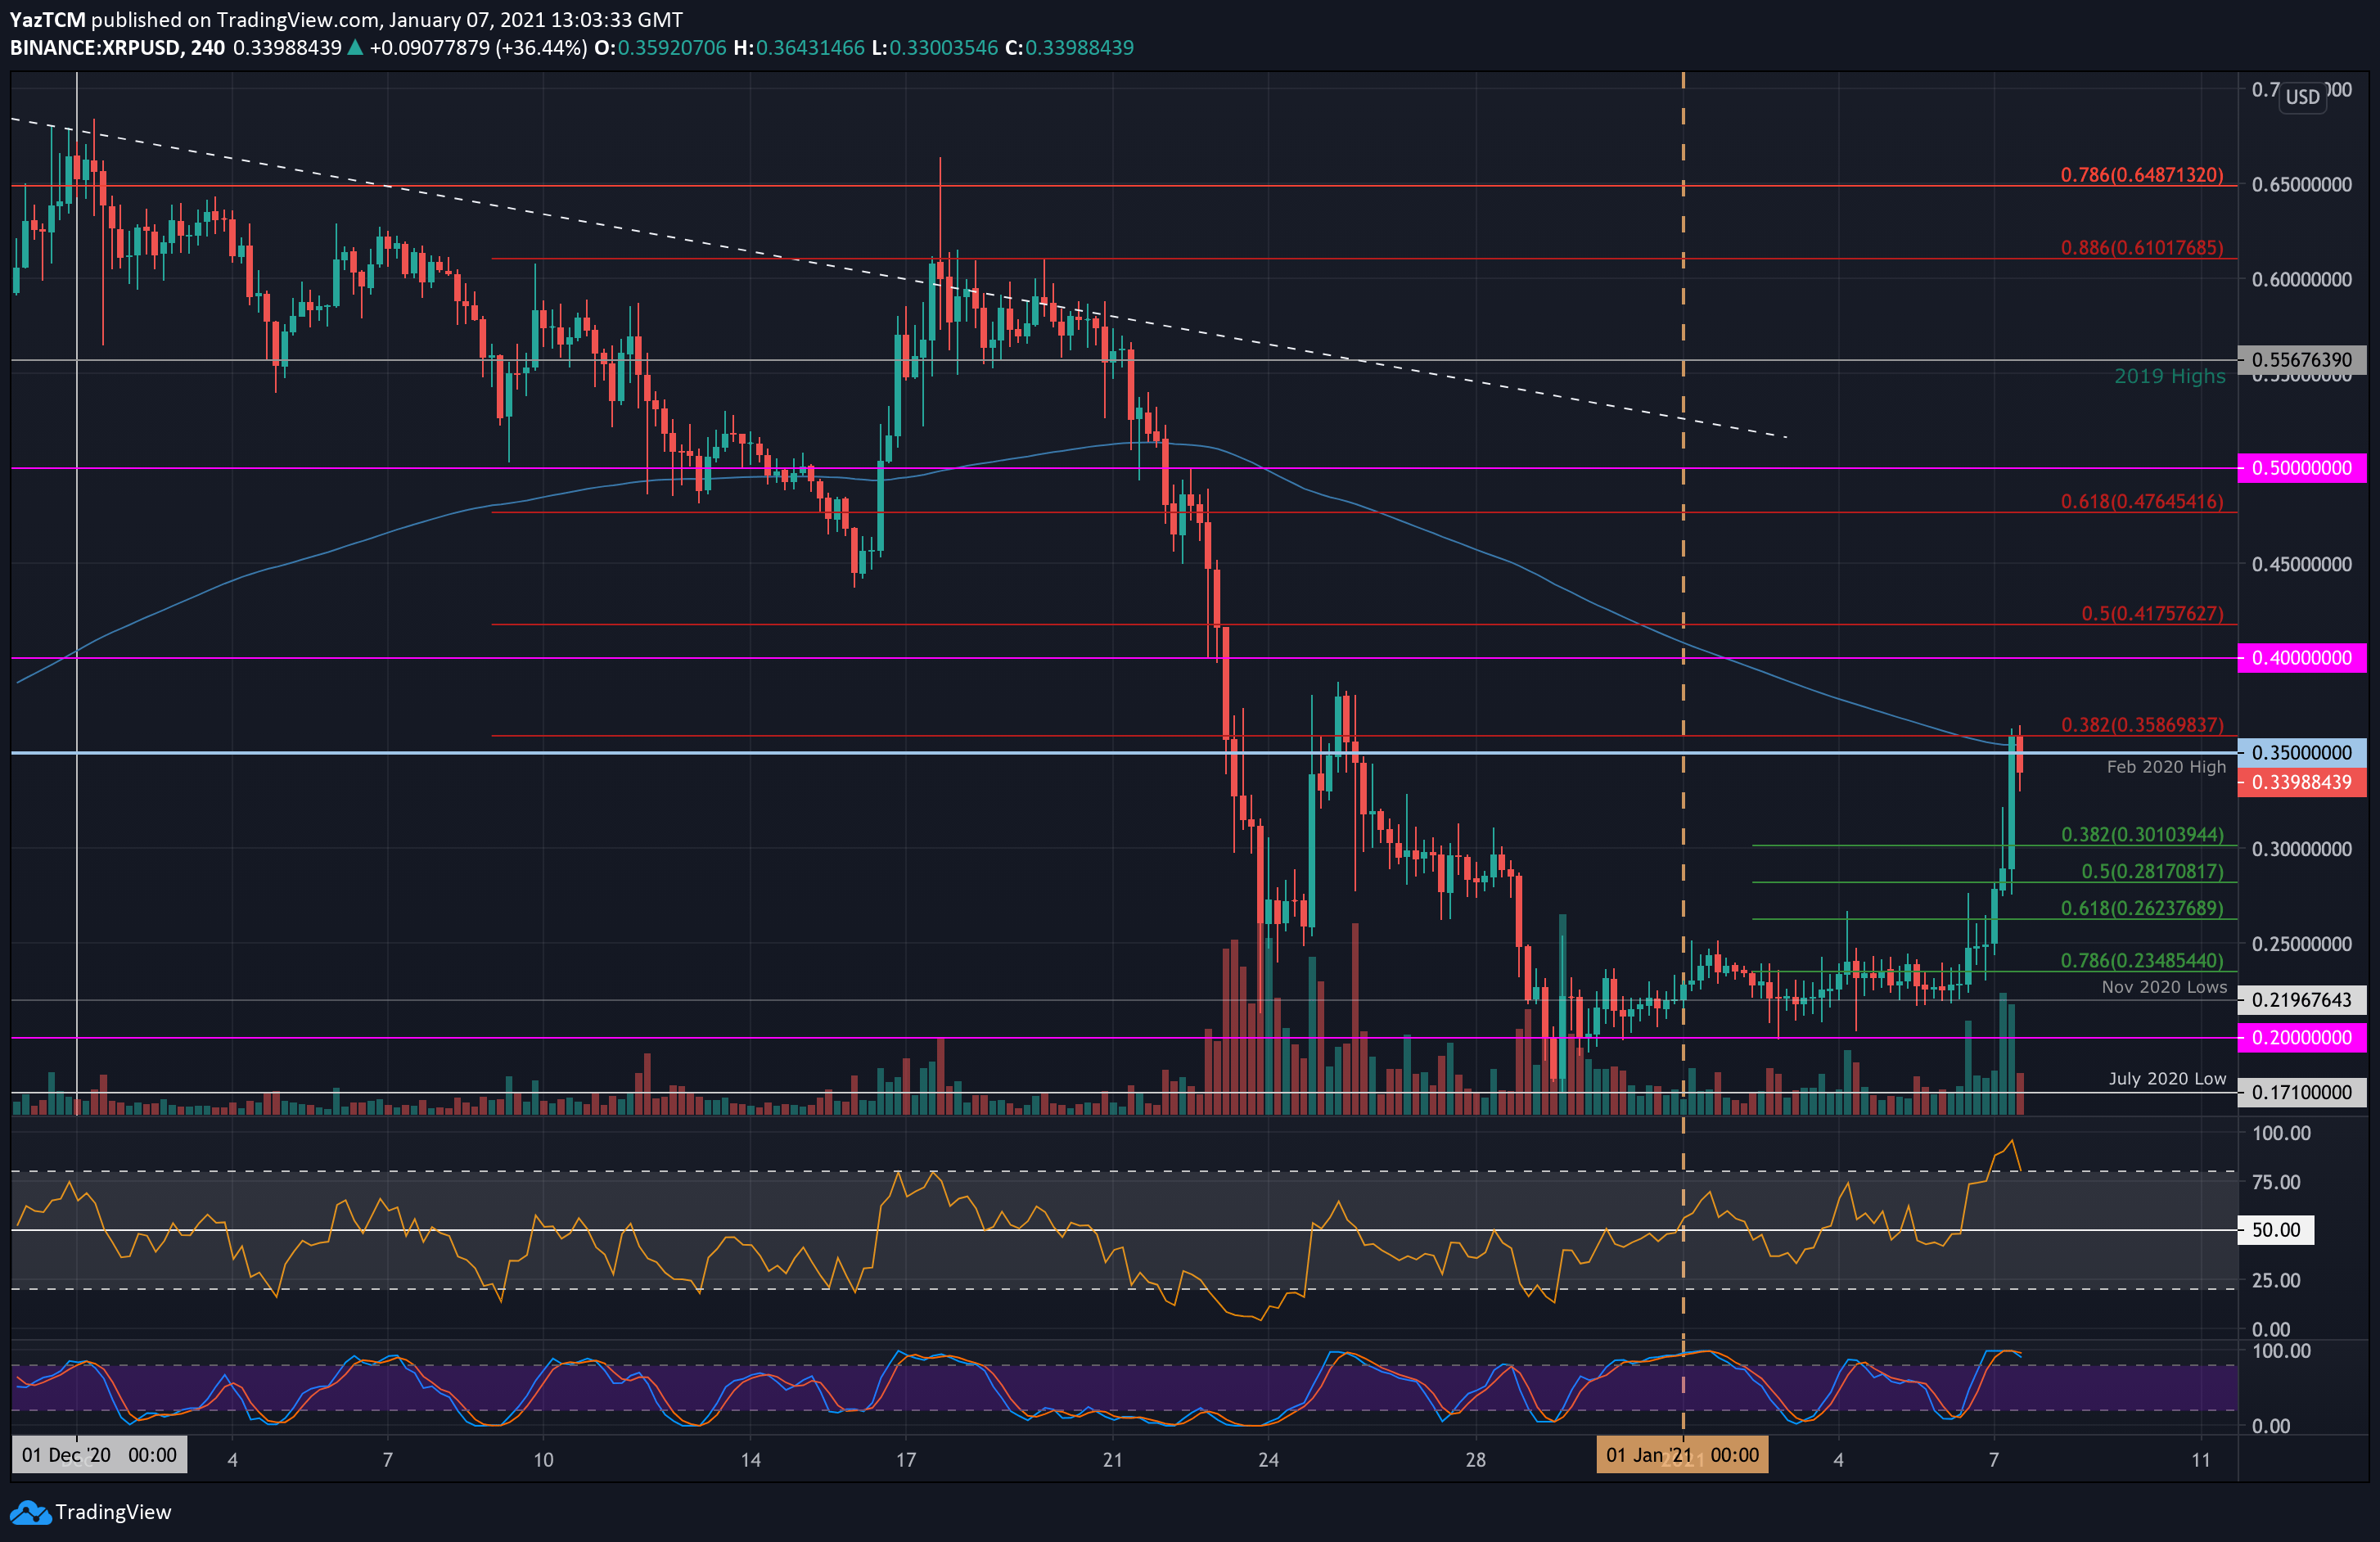
XRP/USD Daily Chart. Source: TradingView
Key Support Levels: $0.3, $0.281, $0.262.
Key Resistance Levels: $0.358, $0.38, $0.4.
After the disastrous trading action in December, in which XRP fell by over 70%, the coin managed to hold above the November 2020 lows at $0.22 for the first week of January. Yesterday, XRP started to push higher above this support to reach $0.25.
Today, XRP exploded from $0.25 as it surged past $0.3. It continued to break above the Feb 2020 highs at $0.35 until resistance was met at $0.358 – provided by a bearish .382 Fib Retracement.
Looking ahead, the first level of resistance lies at $0.358 (bearish .382 Fib). This is followed by $0.38, $0.4, and $0.417 (bearish .5 Fib). Additional resistance is found at $0.45, $0.476 (bearish .618), and $0.5.
On the other side, the first level of support lies at $0.3 (.382 Fib). This is followed by $0.281 (.5 Fib), $0.262 (.618 Fib), and $0.25.
The 4-HR RSI reached extreme overbought conditions but has since dropped lower. Additionally, the 4-HR Stochastic RSI is primed for a bearish crossover signal.
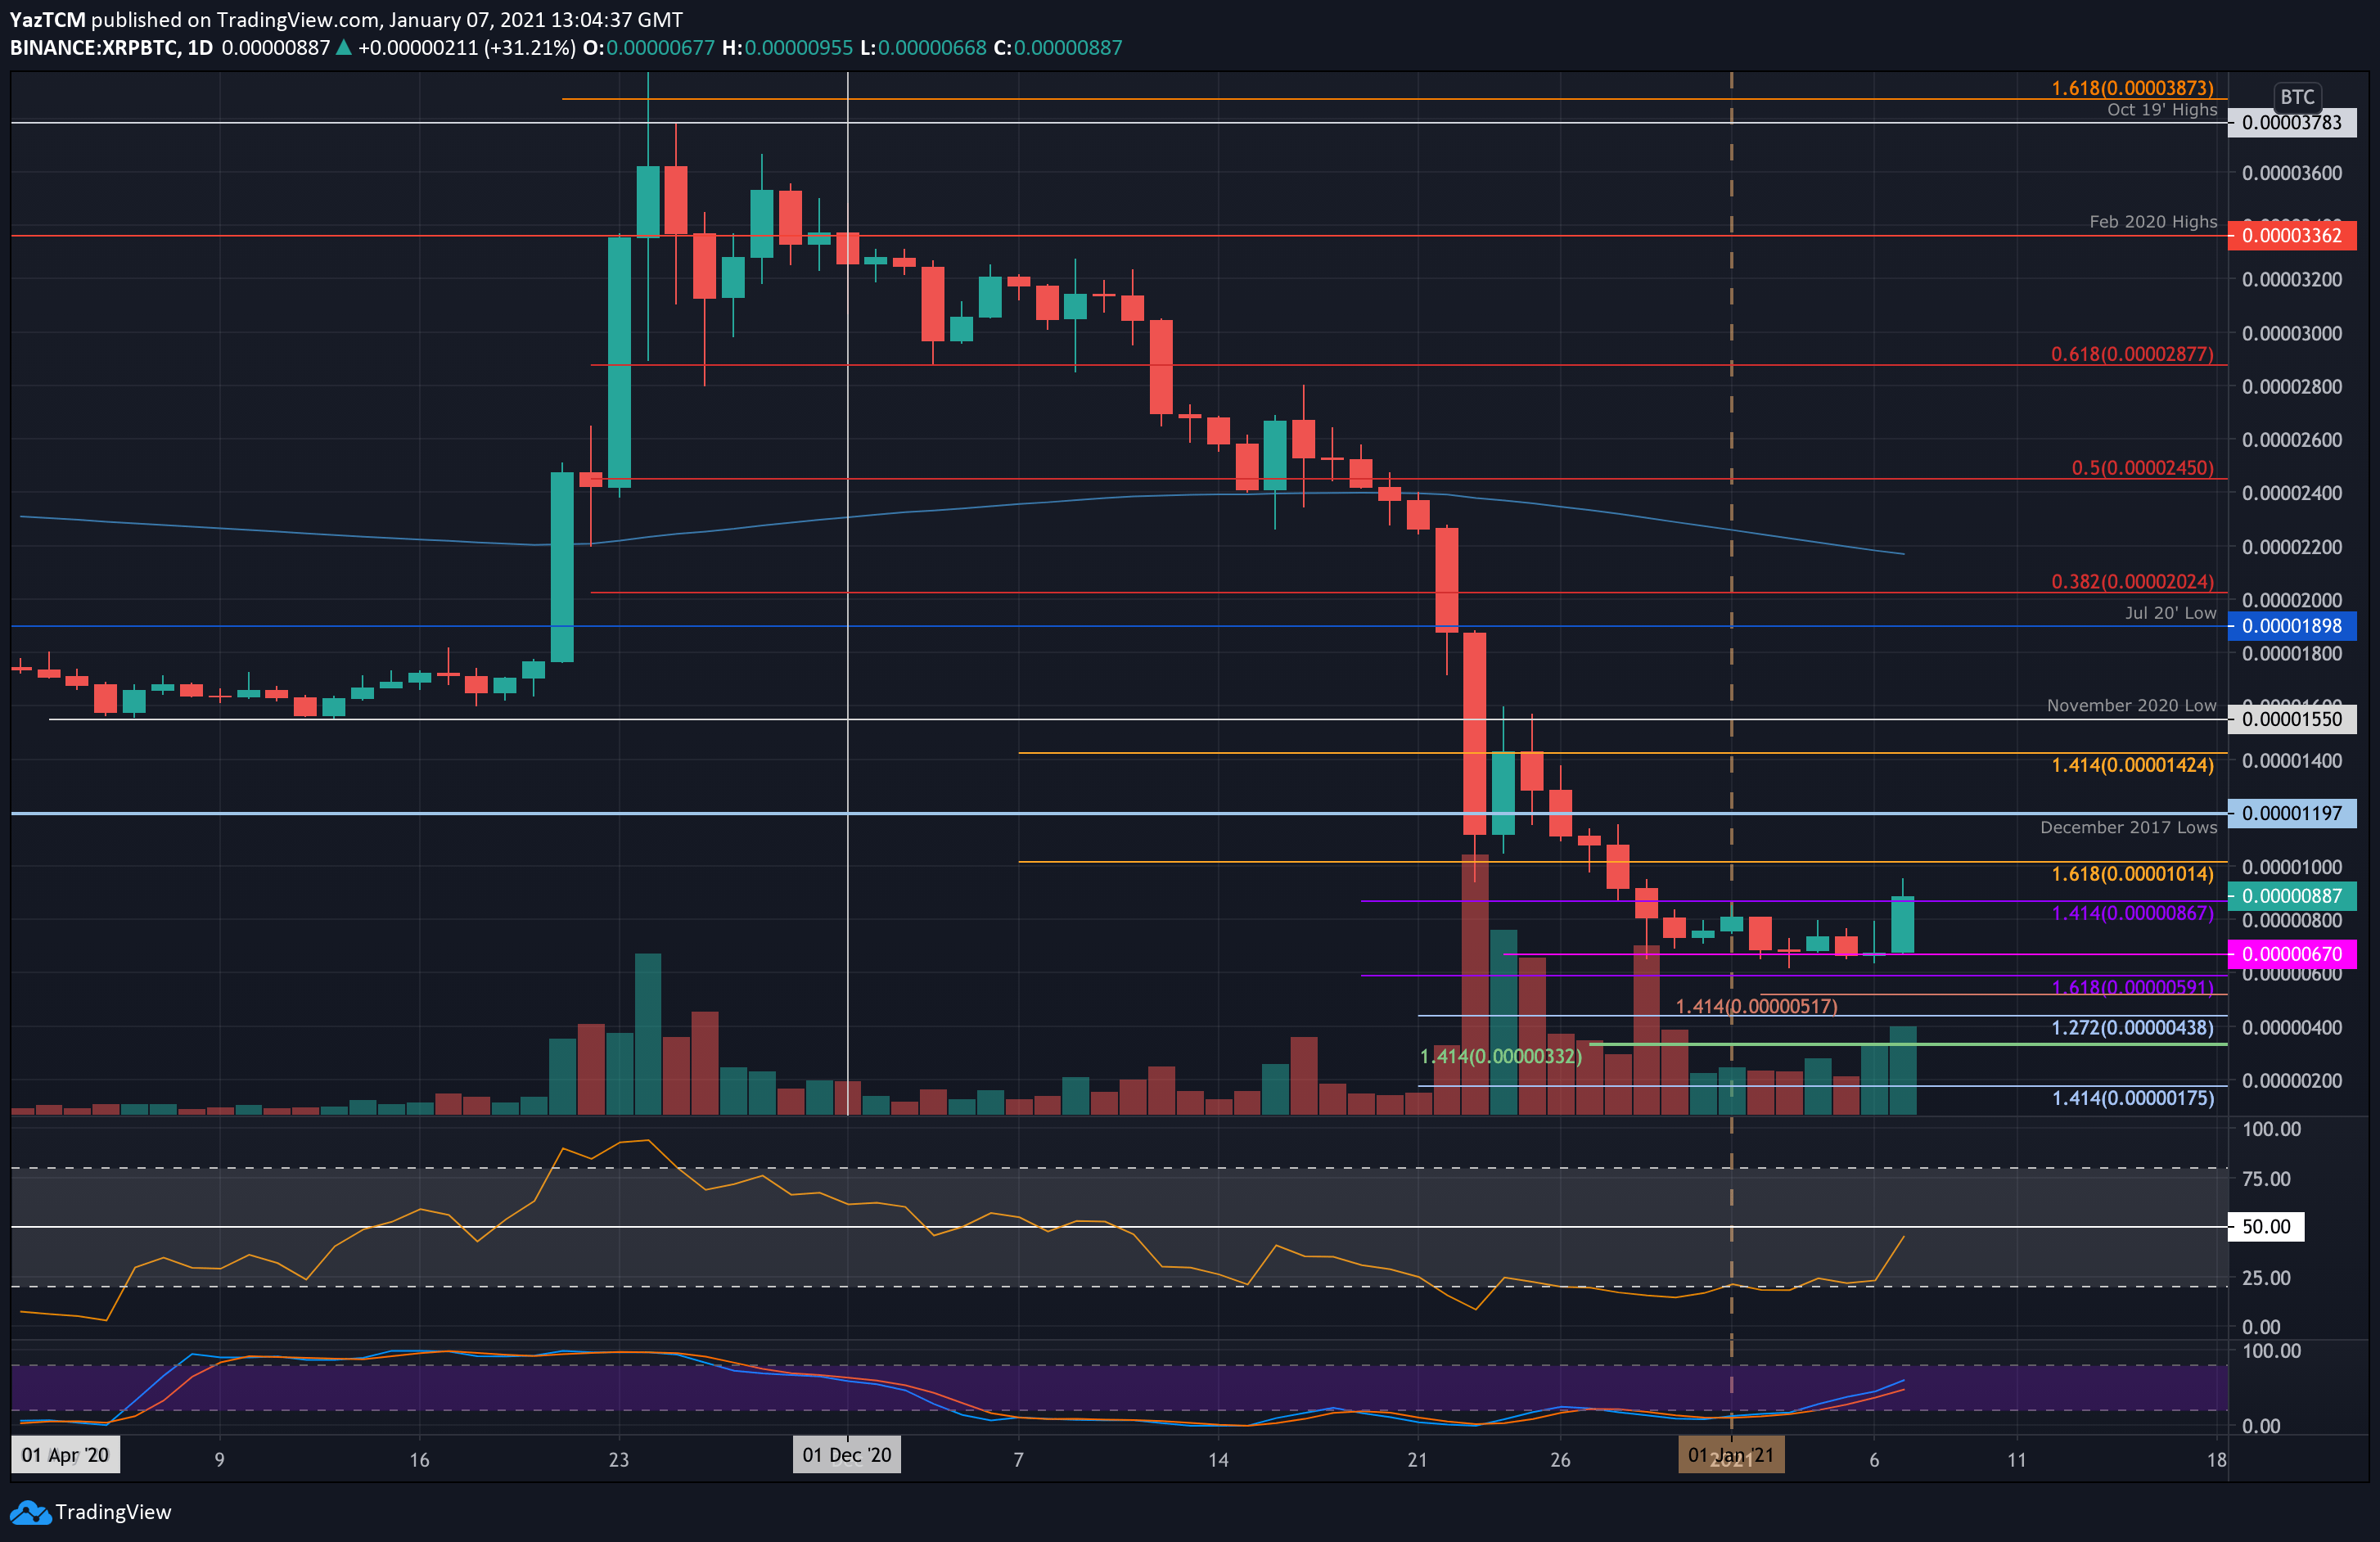
Key Support Levels: 670 SAT SAT, 590 SAT, 500 SAT.
Key Resistance Levels: 800 SAT, 1015 SAT, 1200 SAT.
Against Bitcoin, XRP continued to trade at the established support around 670 SAT for the entire first week of 2021. Over the course of the week, the coin spiked higher but could never overcome the 800 SAT resistance.
Today, XRP rebounded from 670 SAT and finally penetrated beyond 800 SAT. It managed to reach as high as 955 SAT before dropping lower to the current 888 SAT level.
Moving forward, the first level of resistance lies at 1015 SAT. This is followed by 1200 SAT (December 2017 Lows), 1425 SAT, and 1550 SAT (November 2020 low).
On the other side, the first level of support lies at 800 SAT. This is followed by 670 SAT, 590 SAT, and 500 SAT.
The RSI has pushed higher from oversold conditions and is approaching the mid-line. It still will need to overcome the mid-line for the bullish momentum to take control.