XRP/USD:
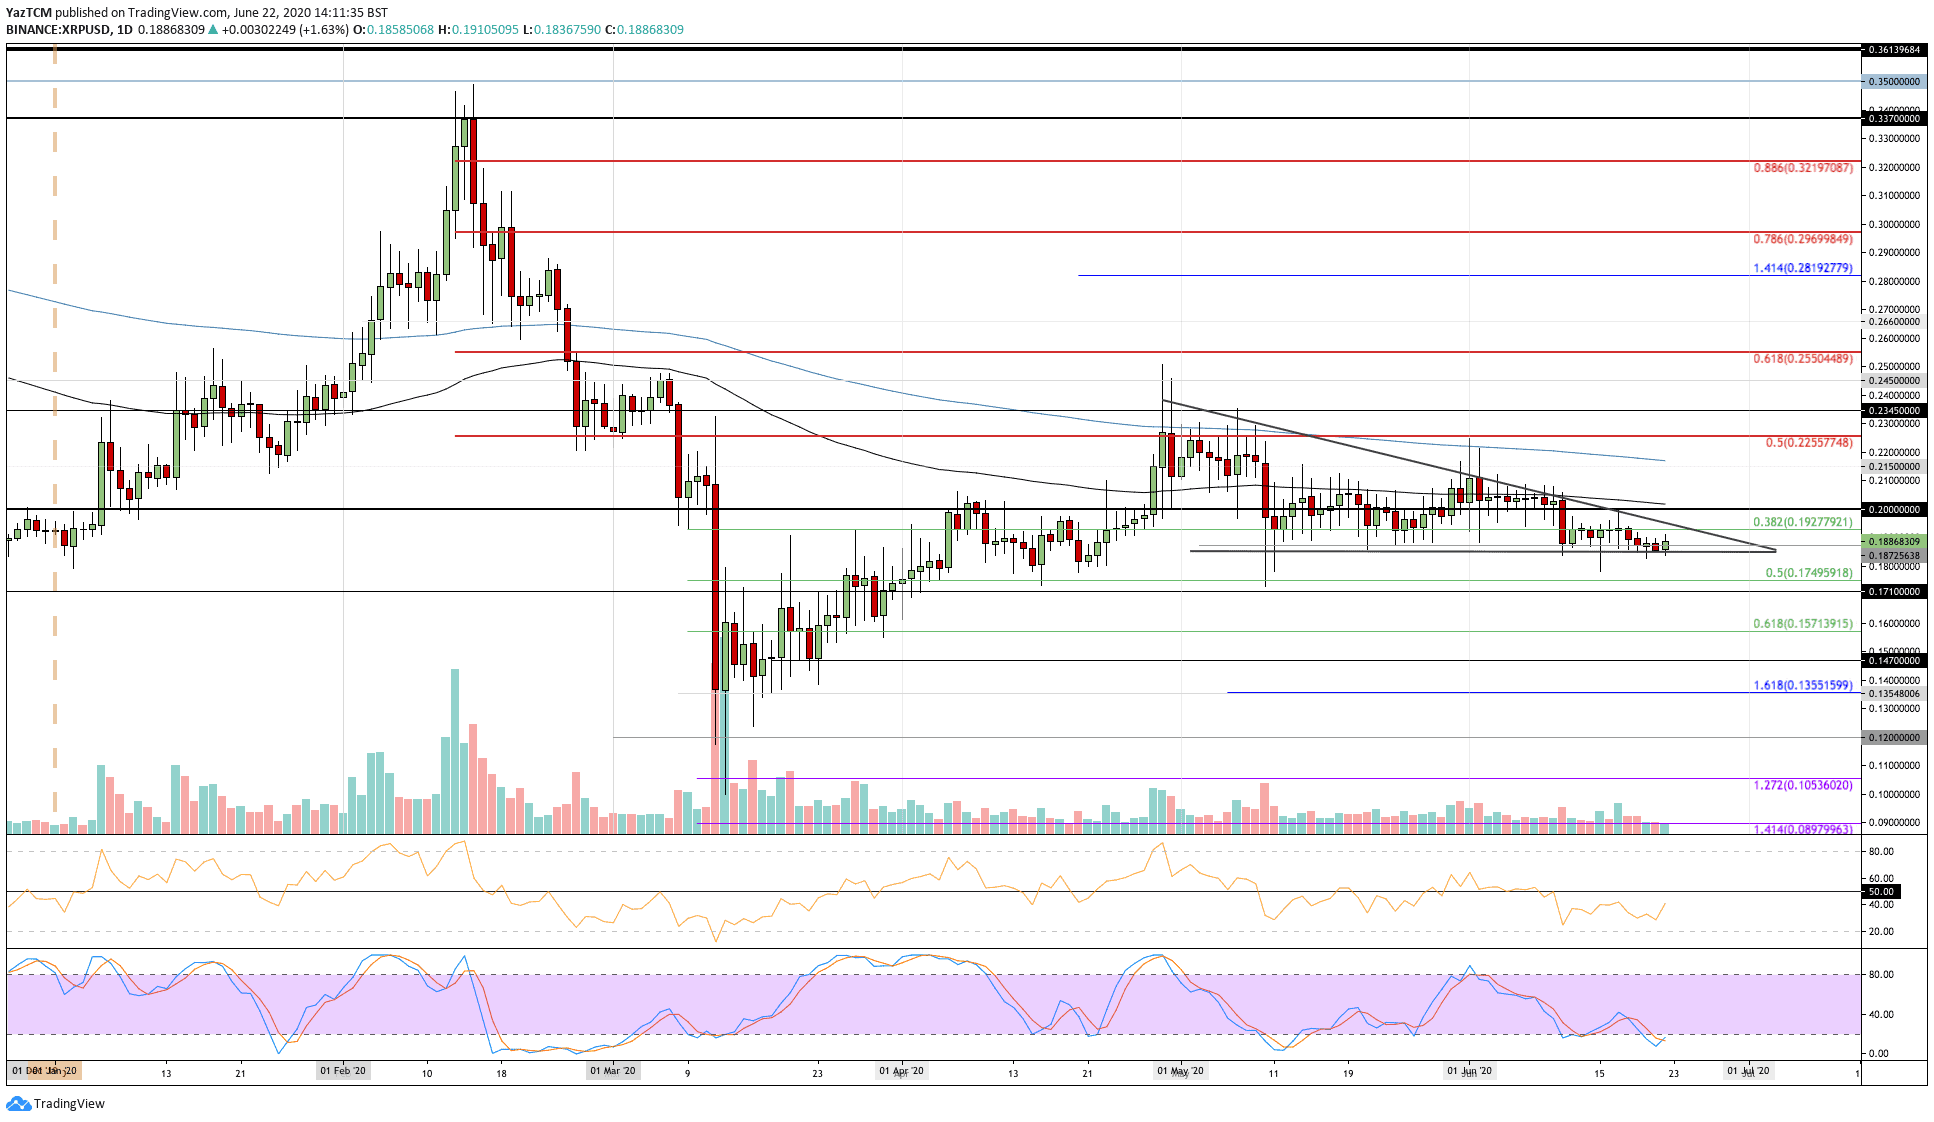
Support: $0.18, $0.175, $0.171.
Resistance: $0.192, $0.20, $0.207.
XRP/BTC:
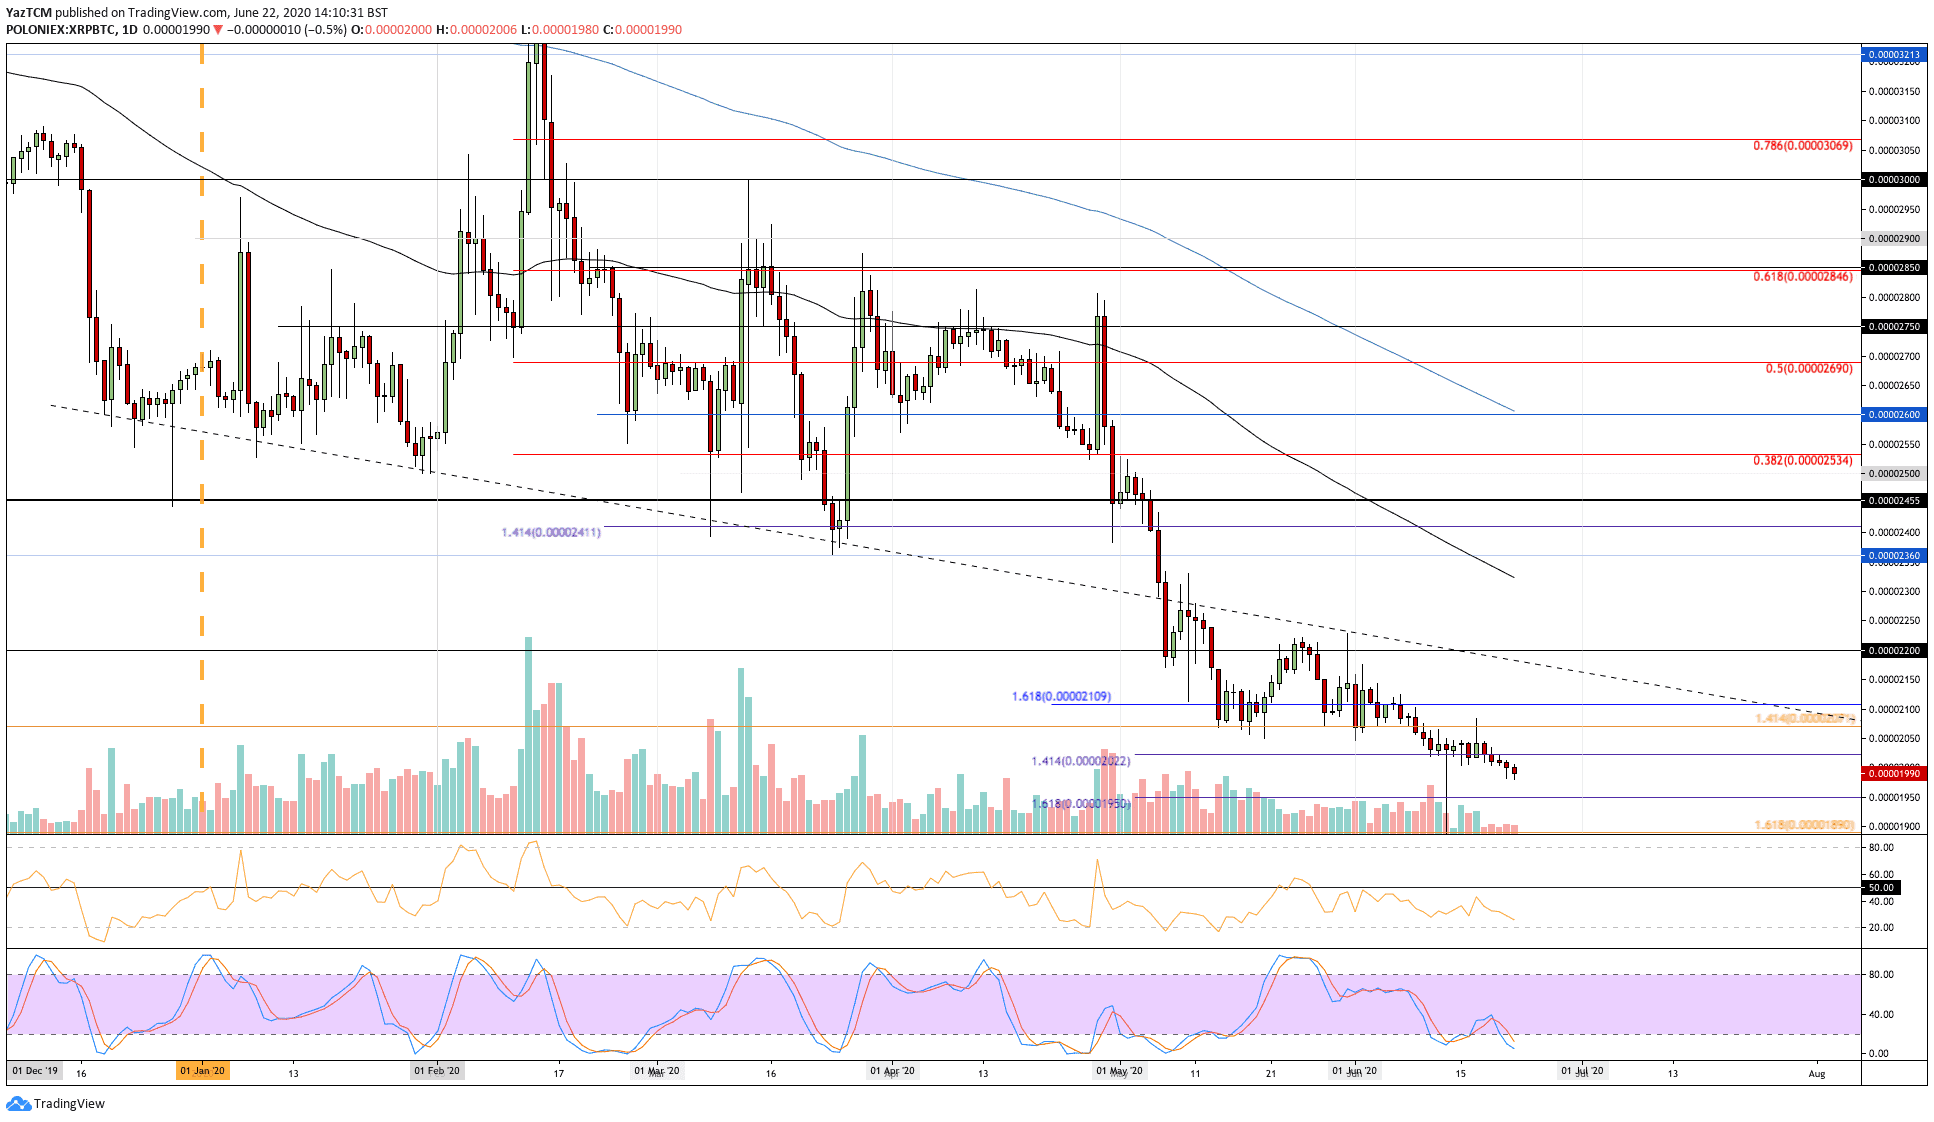
Support: 1950 SAT, 1900 SAT, 1890 SAT.
Resistance: 2022 SAT, 2050 SAT, 2100 SAT.
XRP has been trading within a descending triangle since the first of May 2020. The cryptocurrency has been trapped beneath a falling trend line, which formed the upper boundary of the triangle. XRP was strongly supported at $0.184 throughout May and June and, therefore, this is the base of the triangle.
XRP recently dropped beneath the $0.19 support and reached the lower boundary a few days ago. The buyers are battling to keep XRP above the support. However, it looks increasingly likely that XRP will drop beneath the triangle.
Looking ahead, if the sellers do push beneath the triangle and below $0.18, support can be found at $0.175 (.5 Fib Retracement), $0.171, and $0.157 (.618 Fib Retracement).
On the other side, if the buyers push higher, the first level of resistance lies at $0.192, which is the upper boundary of the triangle. Above this, added resistance is found at $0.20 (100-day EMA), $0.21, and $0.215 (200-day EMA).
The RSI is rising but remains beneath the 50 line as the sellers dominate control of the market momentum. For a push above the triangle, the RSI would need to break above 50 to indicate bullish momentum within the market.
Against Bitcoin, the situation is turning from dire to disastrous. XRP was holding the support at 2022 SAT for the past two weeks of trading. However, over the past few days, XRP dropped beneath 2022 SAT as it headed beneath 2000 SAT to reach 1990 SAT.
This break beneath 2000 SAT now puts XRP at fresh lows against BTC that have not been seen since early December 2017.
If the sellers continue to drive XRP lower, the first level of support lies at 1950 SAT. This is followed by support at 1920 SAT, 1900 SAT, and 1890 SAT.
On the other side, the first level of resistance lies a 2022 SAT. Above this, resistance is found at 2050 SAT and 2100 SAT.
The RSI is beneath the 50 line as the sellers dominate the market momentum. For a push toward 2100 SAT, the RSI must break above 50 to allow the buyers to control the momentum.