XRP has continued to slide after its price dropped by 7% to $0.2933. The latest decrease caused the price to drop beneath a consolidation pattern as the bulls have scrambled to bring XRP back above $0.30.
XRP remains the third-largest cryptocurrency by market value, with a market cap of $12.65 billion. The latest price declines are largely due to XRP having fallen against BTC. However, there is some hope on the horizon, as the bulls are potentially poised for a push higher.
Looking at the XRP/USD 1-day chart:
- Since our previous XRP/USD analysis, XRP fell beneath the symmetrical triangle consolidation pattern that we tracked. The cryptocurrency’s price dropped to as low as $0.28 in today’s trading session, but the bulls have since stepped back in to drive XRP higher.
- From above: The nearest level of resistance lies at $0.30, which has provided very strong support during 2019. Above $0.30, resistance lies at $0.3177, $0.3371, and $0.35. The resistance between $0.35 and $0.36 is bolstered by both the 100- and 200-day EMAs.
- From below: If the sellers push the market under $0.30, we could see XRP head lower. Support is expected at $0.2890, $0.2811, and $0.28. If the selling continues, further support is expected at $0.2747, $0.2687, and $0.2621.
- The trading volume remains around this month’s average level.
- The RSI has plummeted toward extreme oversold conditions as the bulls remain in complete control.
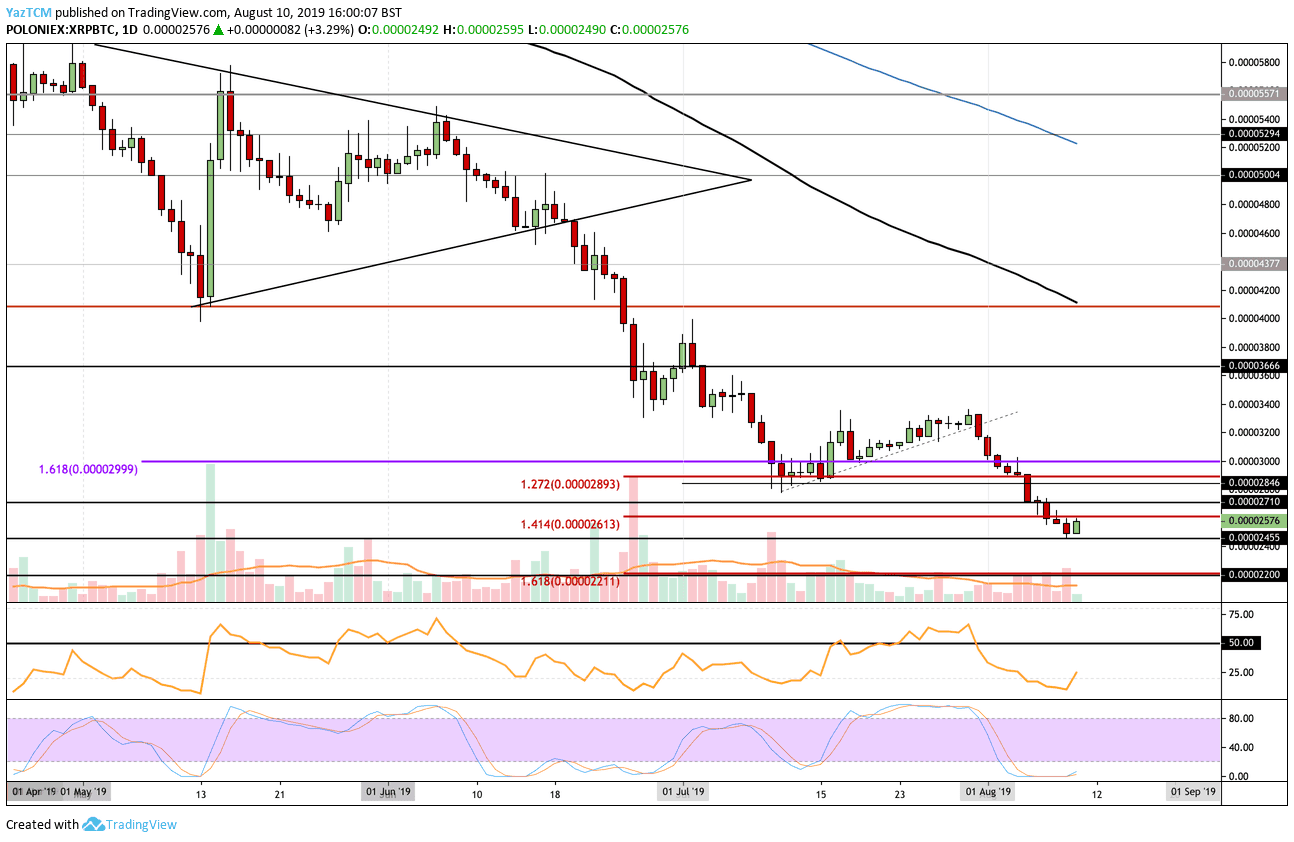
Looking at the XRP/BTC 1-day chart:
- Trading against Bitcoin, XRP has plummeted beneath the support at 2,613 satoshi but managed to bounce at the 2,455 sat level. If the bulls can push the price back above 2,613 sat in the next few days, that may indicate a short-term rebound.
- From above: The nearest level of resistance lies at 2,613 sat. Above this, resistance lies at 2,710 sat, 2,846 sat, and 3,000 sat. If a rebound continues above 3,000 sat, higher resistance is expected at 3,200 sat, 3,400 sat, 3,666 sat, and 4,000 sat.
- From below: If the sellers push the price lower, we can expect immediate support at 2,455 sat. Beneath this, further support is located at 2,400 sat and 2,211 sat.
- The RSI has rebounded from extreme oversold conditions, suggesting that the selling momentum has started to diminish. Furthermore, the Stochastic RSI has also produced a bullish crossover signal as we wait for the moving averages to diverge.
SPECIAL OFFER (Sponsored)
Binance Free $600 (CryptoPotato Exclusive): Use this link to register new account and receive $600 exclusive welcome offer on Binance (
full details).
LIMITED OFFER 2024 for CryptoPotato readers at Bybit: Use this link to register and open a $500 BTC-USDT position on Bybit Exchange for free!
Disclaimer: Information found on CryptoPotato is those of writers quoted. It does not represent the opinions of CryptoPotato on whether to buy, sell, or hold any investments. You are advised to conduct your own research before making any investment decisions. Use provided information at your own risk. See Disclaimer for more information.
Cryptocurrency charts by TradingView.