Ripple’s XRP continues to battle with the $0.40 level after having been supported by the 100-day EMA so far this month. The cryptocurrency’s price has been pretty flat this week, only falling by 4% and failing to close beneath the $0.3750 level. However, things are looking very bleak against Bitcoin, as XRP/BTC continues to slide to 18-month lows.
XRP remains the third-largest cryptocurrency by market value, with a market cap of $16.76 billion. The XRP price has been trapped in a wide range between $0.36 and $0.48 for the past 3 months, having increased by 11% over the past 90 days.
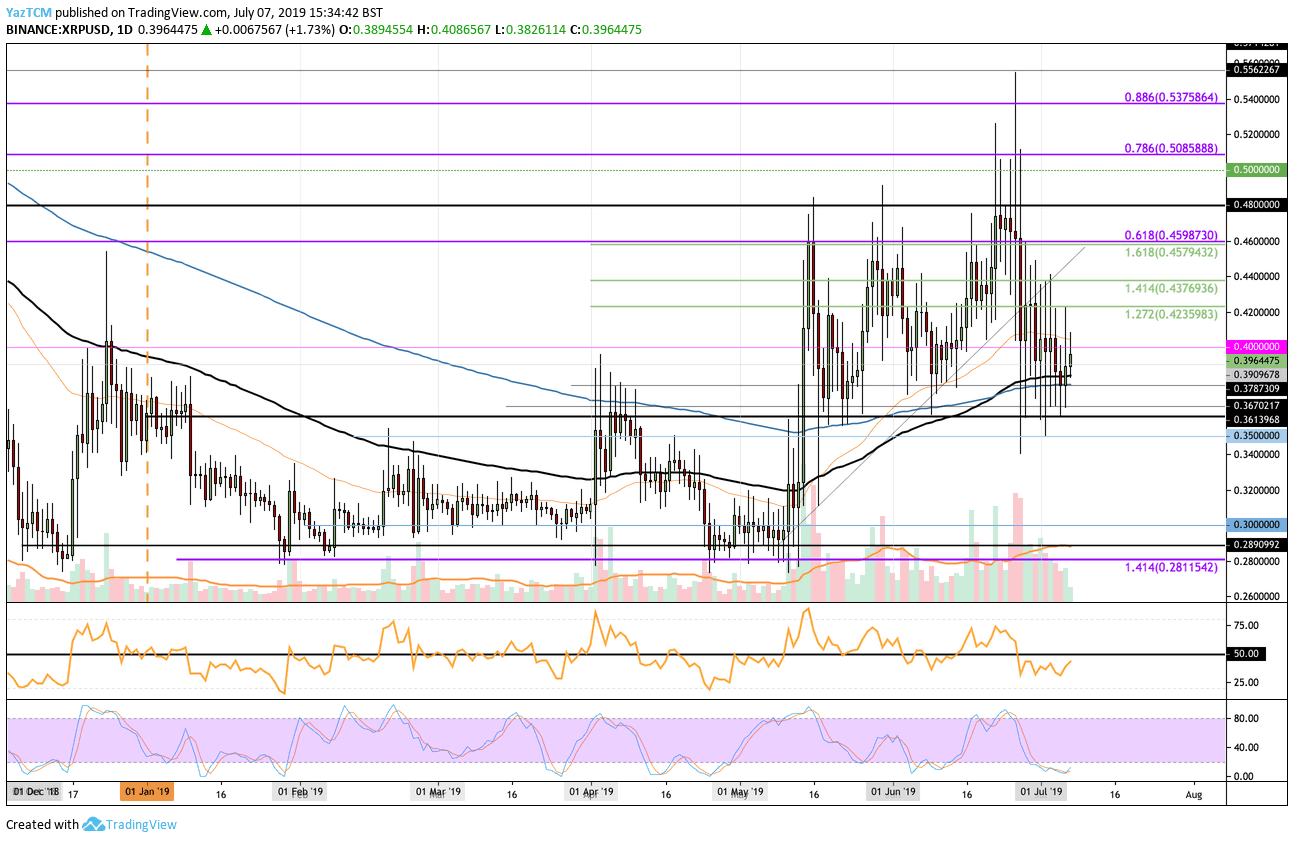
Looking at the XRP/USD 1-day chart:
- Since our previous XRP/USD analysis, XRP has continued to slide lower but has been strongly supported by the 100-day and 200-day EMA at the $0.3787 level. Although the XRP price has decreased, it hasn’t yet managed to close beneath the aforementioned support.
- From above: The nearest level of resistance is located at the $0.40 level. If the bulls can break above it, the next levels of resistance lie at $0.4235, $0.44, and $0.46. Above this, higher resistance is found at $0.48 and $0.50.
- From below: The nearest level of support lies at $0.39 and $0.3787. Beneath this, additional support toward the downside lies at $0.3670, $0.36, and $0.35.
- The Stochastic RSI currently rests in extreme oversold territory as we wait for a bullish crossover signal to push the market higher.
- The trading volume remains high but has started to slowly fade.
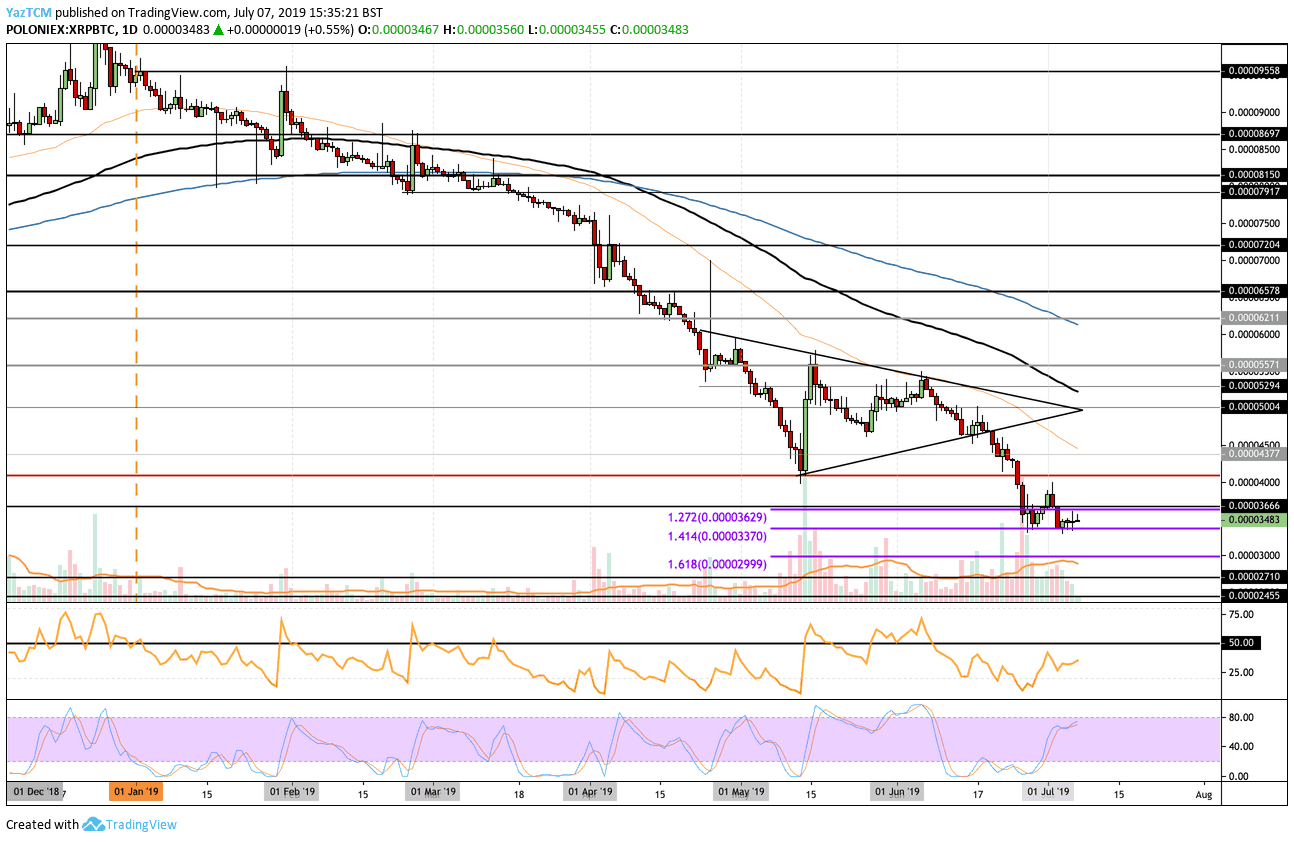
Looking at the XRP/BTC 1-day chart:
- XRP’s support at the 3,370 satoshi level still holds. However, XRP is still trading at 18-month lows against Bitcoin. The coin is now trapped in a range between 3,630 sat and 3,370 sat.
- From above: If the bulls break above the 3,630 sat level, higher resistance lies at 3,666 sat, 3,800 sat, and 4,000 sat. Above 4,000 sat, the next levels of resistance lie at 4,100 sat, 4,400 sat, 5,000 sat, and 5,300 sat (which also contains the 100-day EMA).
- From below: The nearest level of support lies at 3,370 sat. Beneath this, further support lies at 3,300 sat, 3,100 sat, and 3,000 sat. If the sellers continue beneath 3,000 sat, we can find more support at 2,710 sat and 2,455 sat.
- The trading volume fell in this market during the first week of July.
- The RSI is still below 50 which indicates that the bears are in control of the market. In order to see a recovery, we will need to see the RSI move above 50.
SPECIAL OFFER (Sponsored)
Binance Free $600 (CryptoPotato Exclusive): Use this link to register new account and receive $600 exclusive welcome offer on Binance (
full details).
LIMITED OFFER 2024 for CryptoPotato readers at Bybit: Use this link to register and open a $500 BTC-USDT position on Bybit Exchange for free!
Disclaimer: Information found on CryptoPotato is those of writers quoted. It does not represent the opinions of CryptoPotato on whether to buy, sell, or hold any investments. You are advised to conduct your own research before making any investment decisions. Use provided information at your own risk. See Disclaimer for more information.
Cryptocurrency charts by TradingView.