XRP/USD Daily Chart. Source: TradingView
Key Support Levels: $0.27, $0.261, $0.251.
Key Resistance Levels: $0.271, $0.28, $0.286.
XRP surged by 6.8% over the past three days, which allowed the coin to break above the upper boundary of a 2-month-old range at $0.261. This resistance was provided by a bearish .5 Fib Retracement and prevented XRP from pushing higher during both September and October.
After breaking $0.261, XRP continued higher to reach the $0.271 (bearish .618 Fib) resistance today. It has spiked further to reach $0.28 but must close above $0.271 for the bull run to continue higher.
Looking ahead, if the bulls can break $0.271, the first level of resistance lies at $0.28. Above this, resistance lies at $0.286 (bearish .786 Fib), $0.29, and $0.295 (bearish .886 Fib).
Alternatively, if the sellers push lower, the first level of support lies at $0.27. Beneath this, support lies at $0.261 and $0.251.
The RSI has pushed higher toward overbought conditions, but there is still room to continue further – suggesting the bulls are still not exhausted.
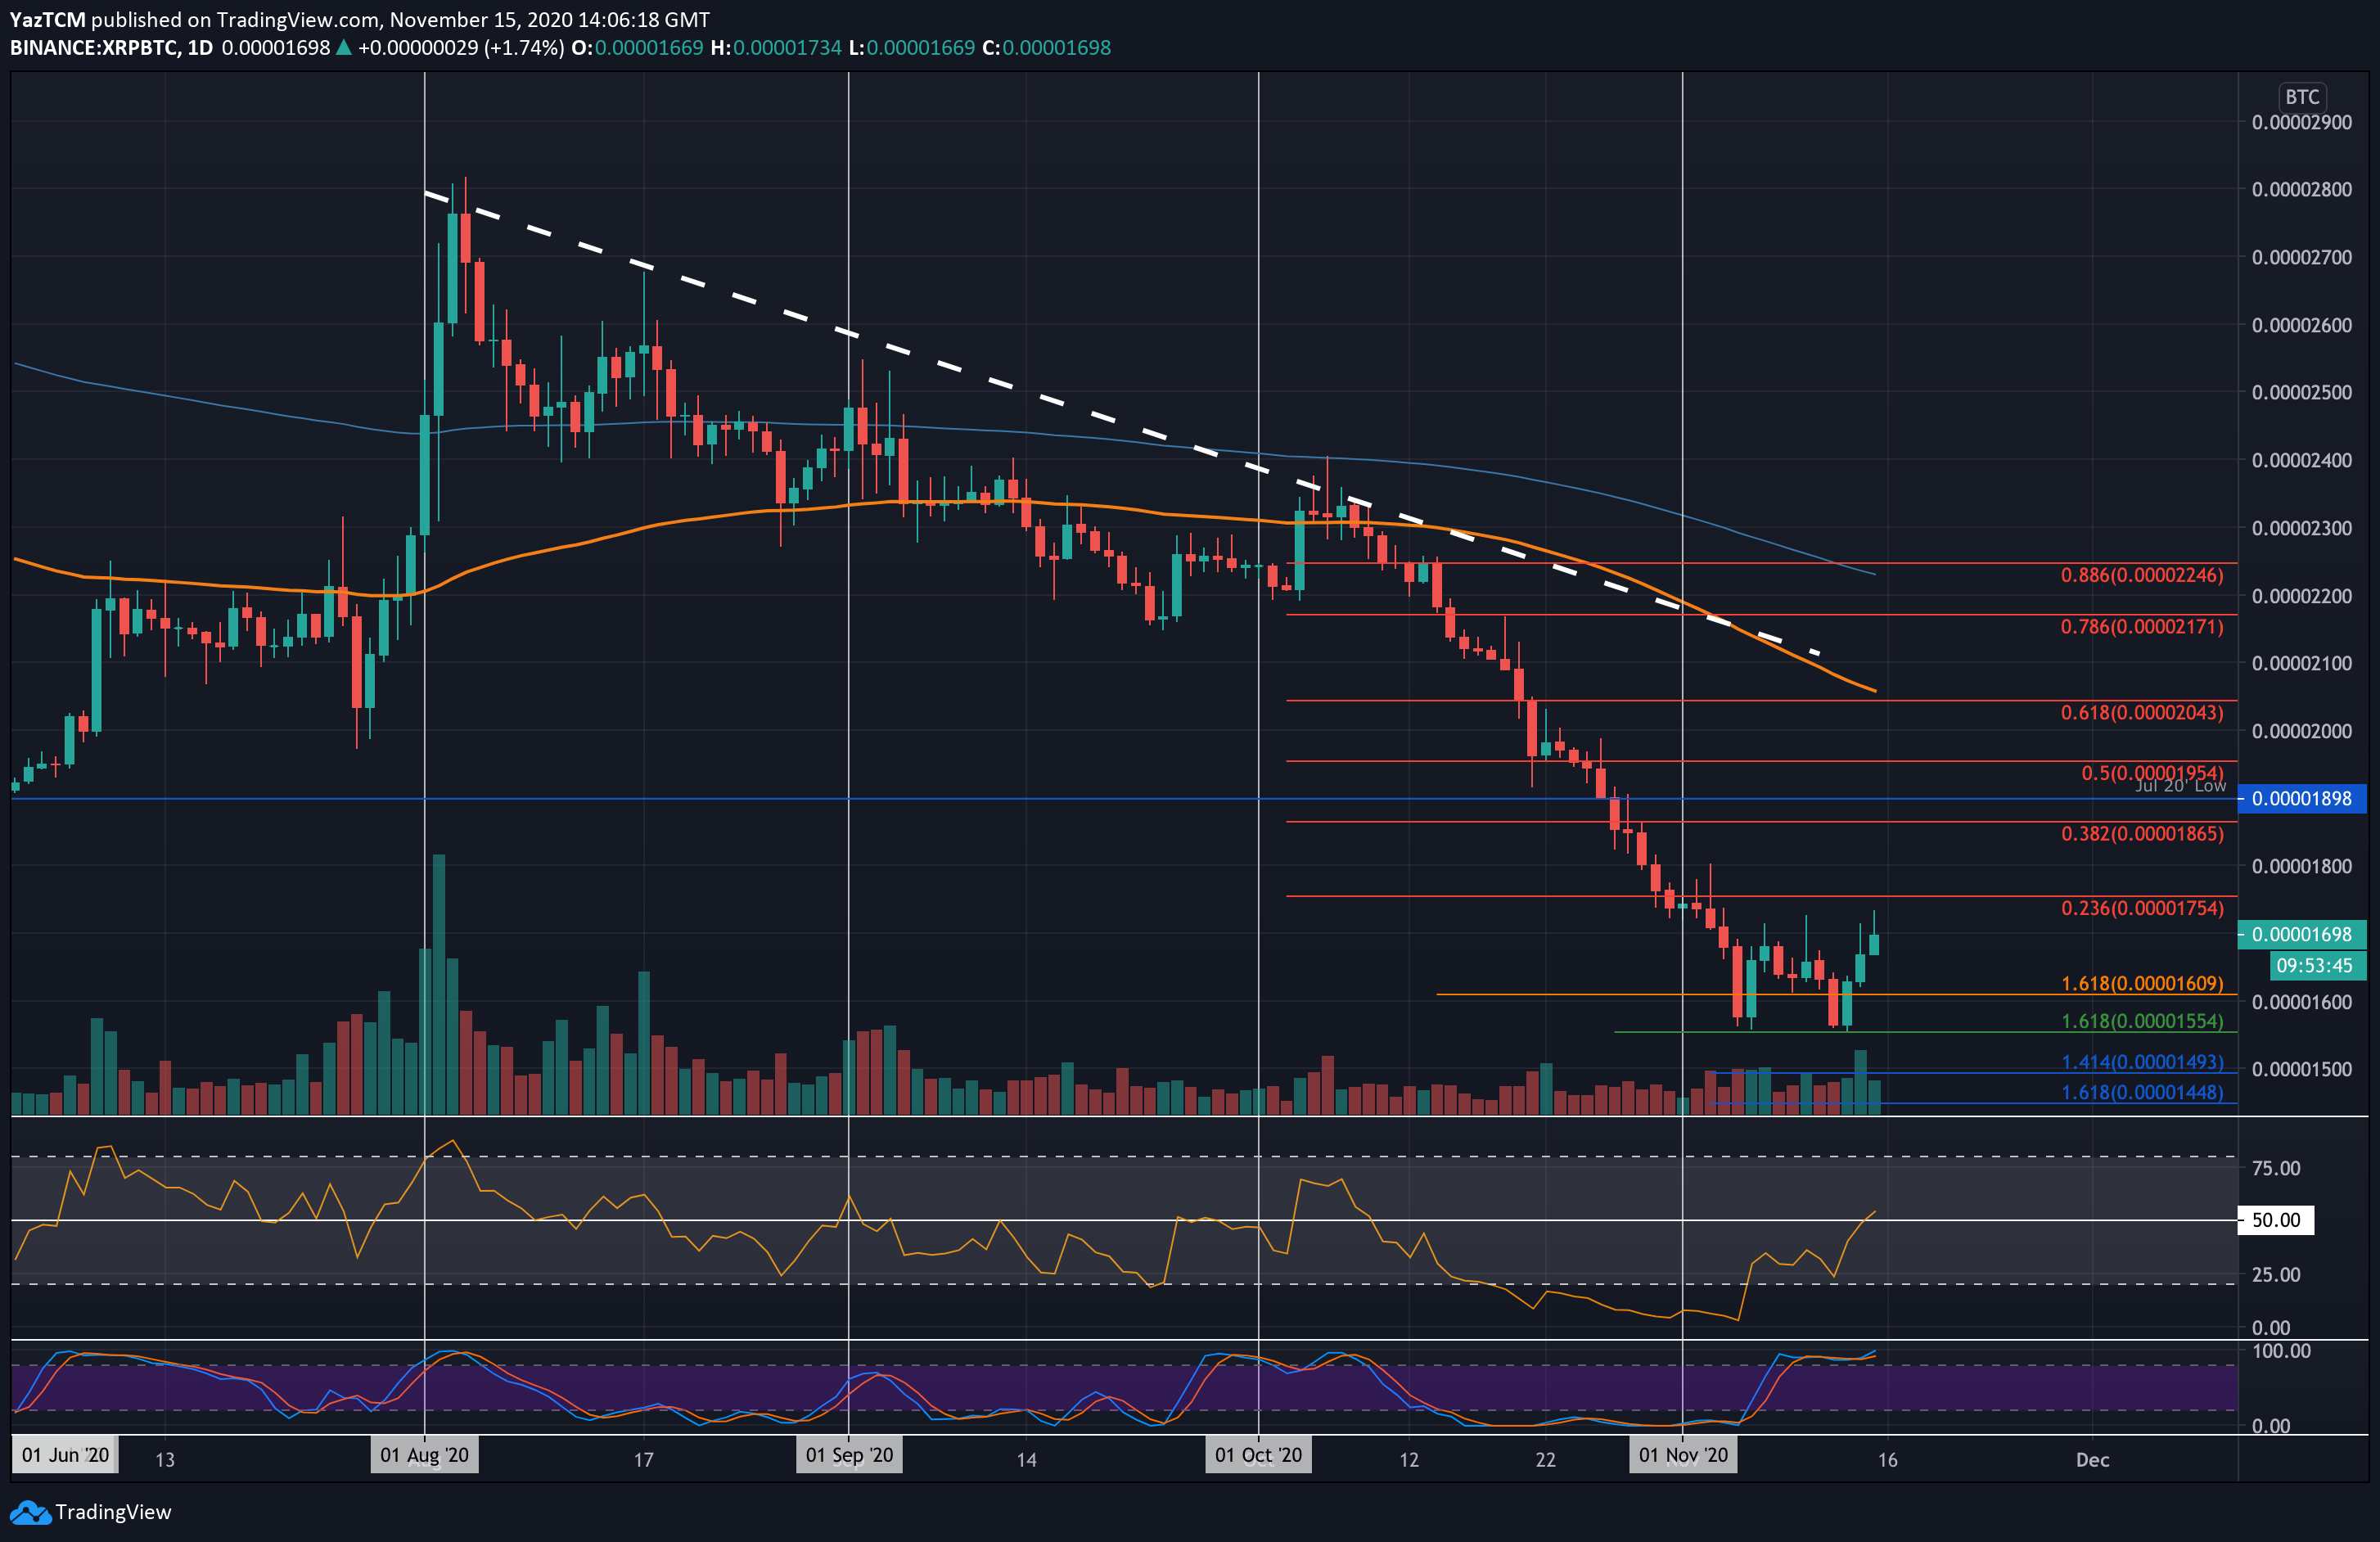
Key Support Levels: 1610 SAT, 1555 SAT, 1500 SAT.
Key Resistance Levels: 1700 SAT, 1755 SAT, 1865 SAT.
Against Bitcoin, XRP rebounded from the 1555 SAT support three days ago as it pushed higher to break 1600 SAT and reach the current 1700 SAT resistance.
The resistance at 1700 SAT has caused trouble for XRP during November, and it must break this for the coin to begin its recovery from the 40% drop it saw since August 2020.
Looking ahead, once the bulls break 1700 SAT, the first level of resistance lies at 1755 SAT (bearish .236 Fib). Above this, resistance is expected at 1865 SAT (bearish .382 Fib), 1900 SAT (July 20’ Lows), and 1954 SAT (bearish .5 Fib).
On the other side, the first level of support lies at 1610 SAT. Beneath 1600 SAT, support lies at 1555 SAT, 1490 SAT, and 1450 SAT.
The RSI just penetrated above the mid-line to indicate that the buyers have taken control of the market momentum. If they can remain above the mid-line, the momentum will turn bullish and allow XRP to rise further.