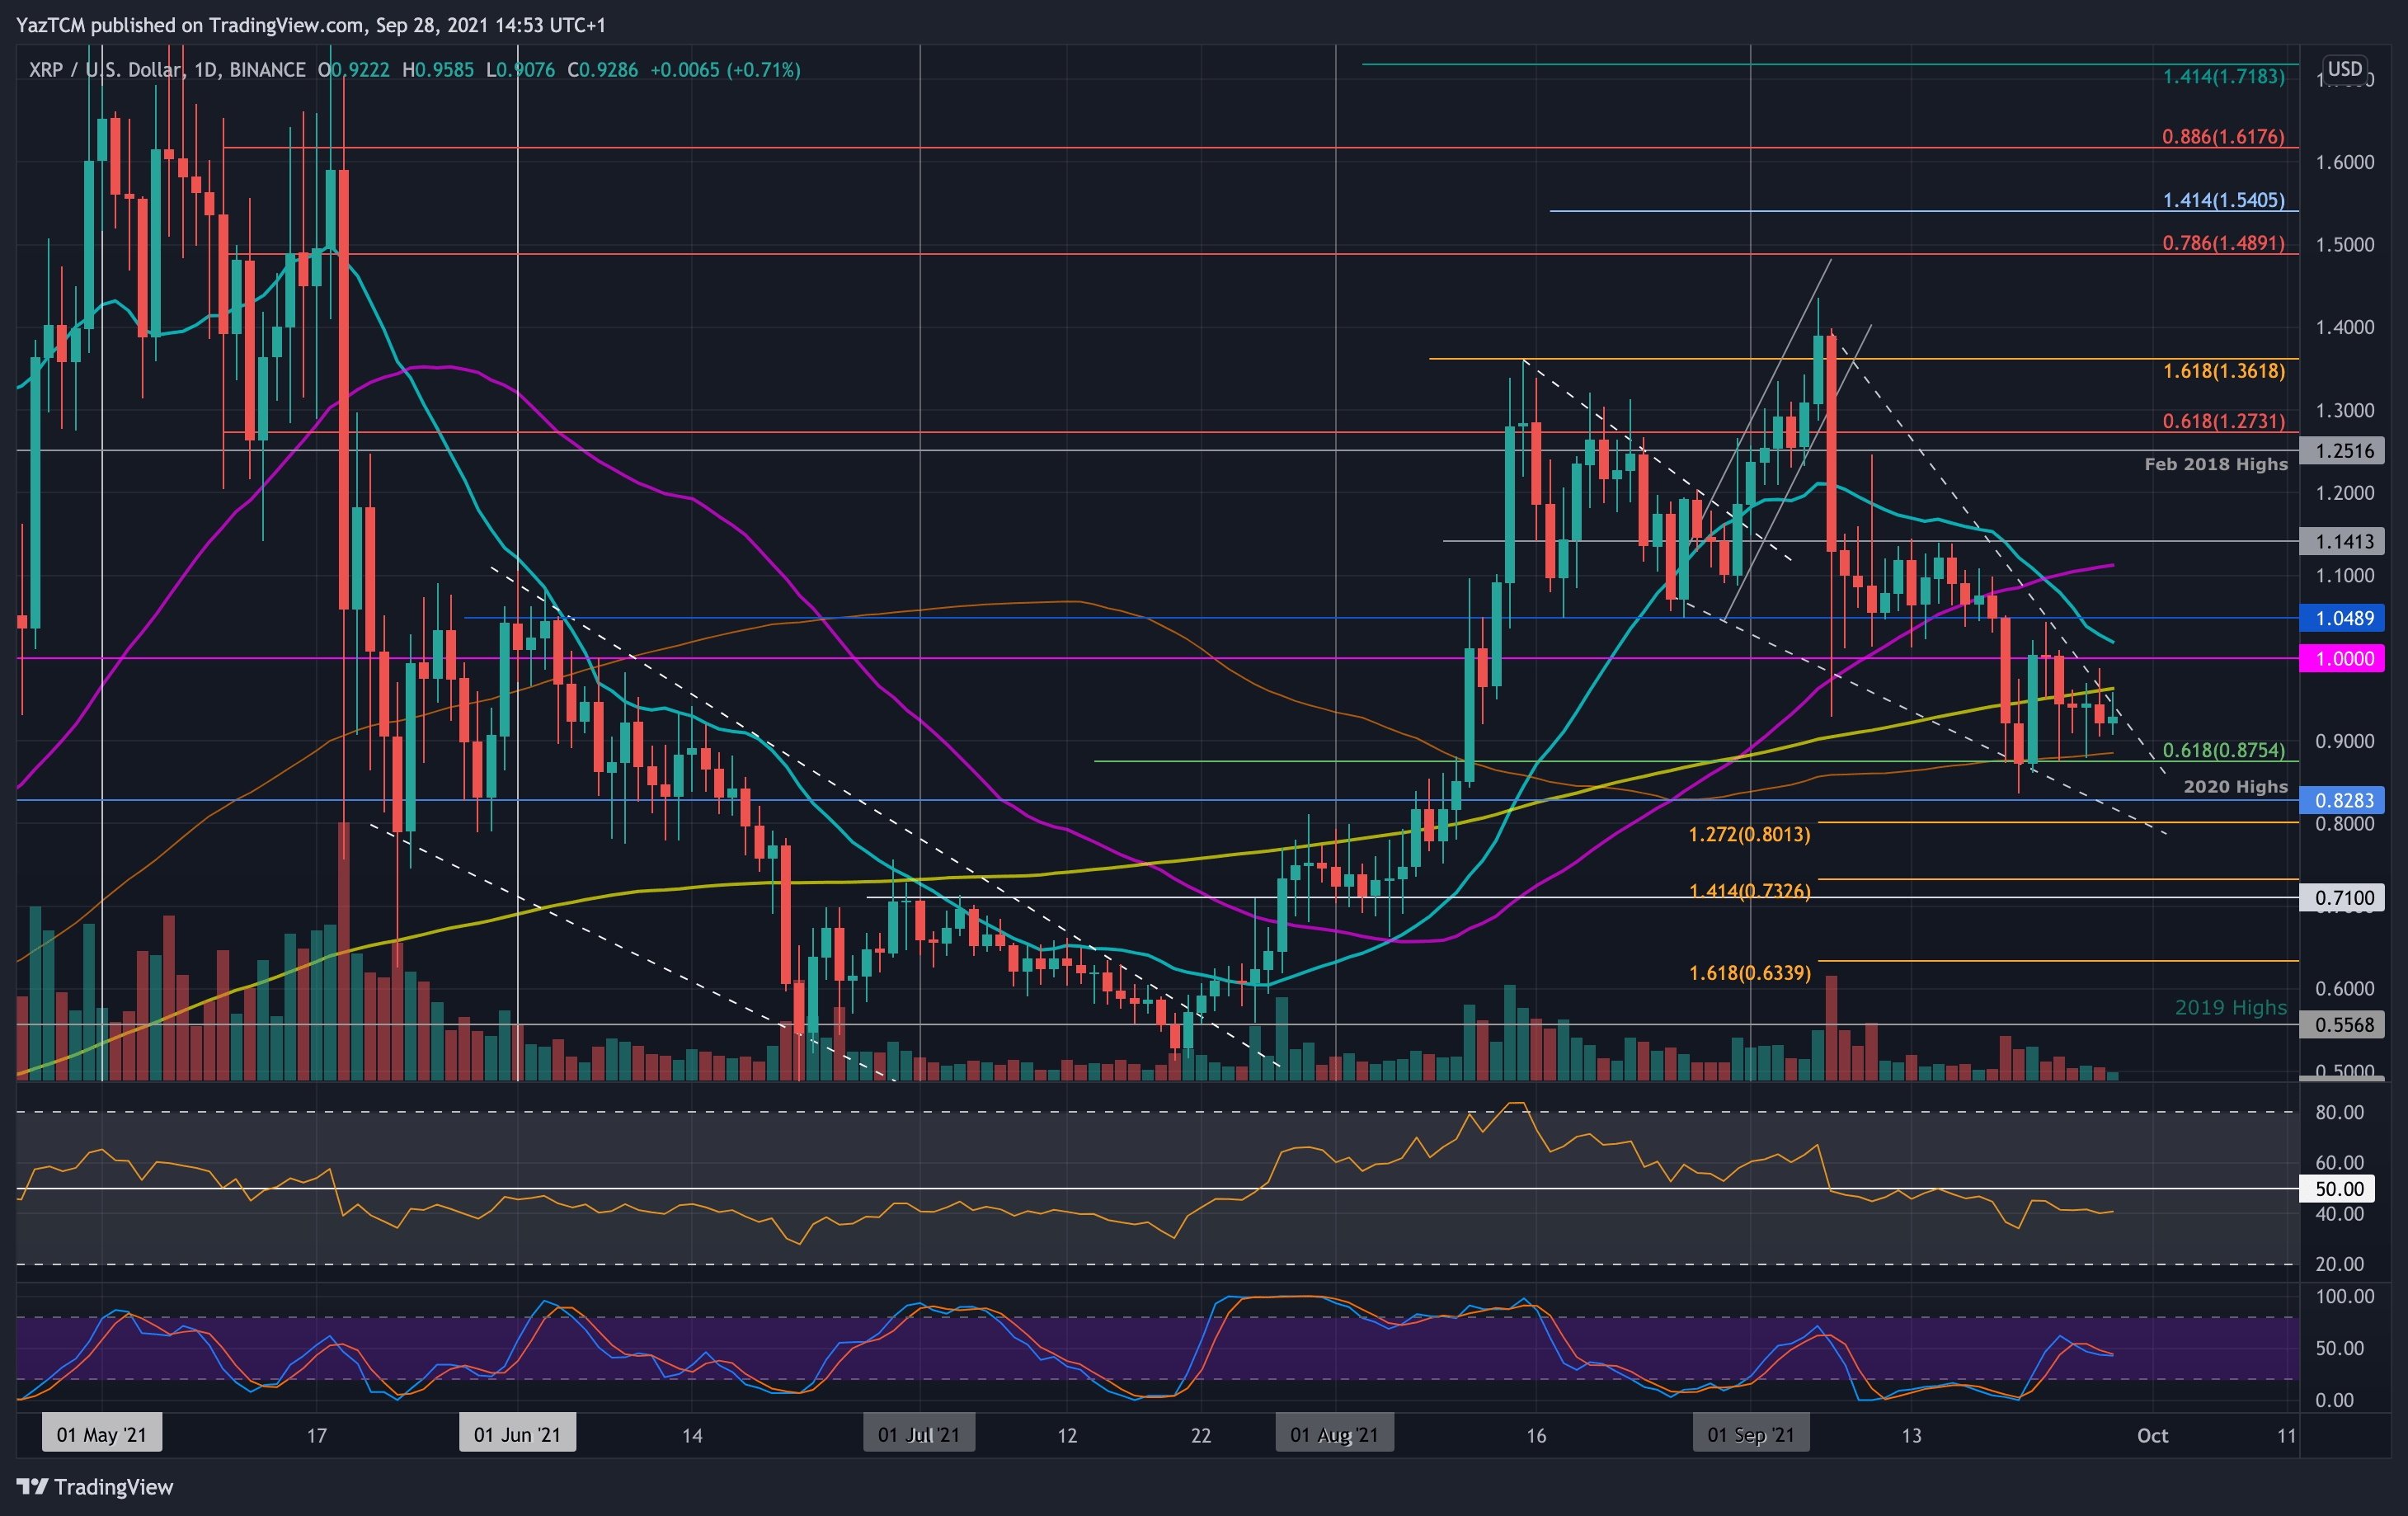
XRP/USD Daily Chart. Source: TradingView.
Key Support Levels: $0.875, $0.8282, $0.8.
Key Resistance Levels: $0.95, $1.0, $1.05.
XRP might be beneath the crucial $1 level but is doing well to hold the 100-day MA. The coin established the support at $0.875 (.618 Fib & 100-day MA) last week and rebounded from there to meet resistance at $1.
Since hitting $1, XRP has moved sideways inside a range between $1 and $0.875. In addition to this, XRP is also trading inside a descending wedge formation as the market poises itself for a potential upside break.
Looking ahead, the first resistance lies at $0.95 (200-day MA). This is followed by $1.00, $1.05, and $1.10 (50-day MA).
On the other side, the first solid support lies at $0.875 (100-day MA & .618 Fib). This is followed by $0.8282 (2020 highs), $0.8 (downside 1.272 Fib Extension), and $0.71.
The daily RSI remains beneath the midline as weak bearish momentum controls the market.
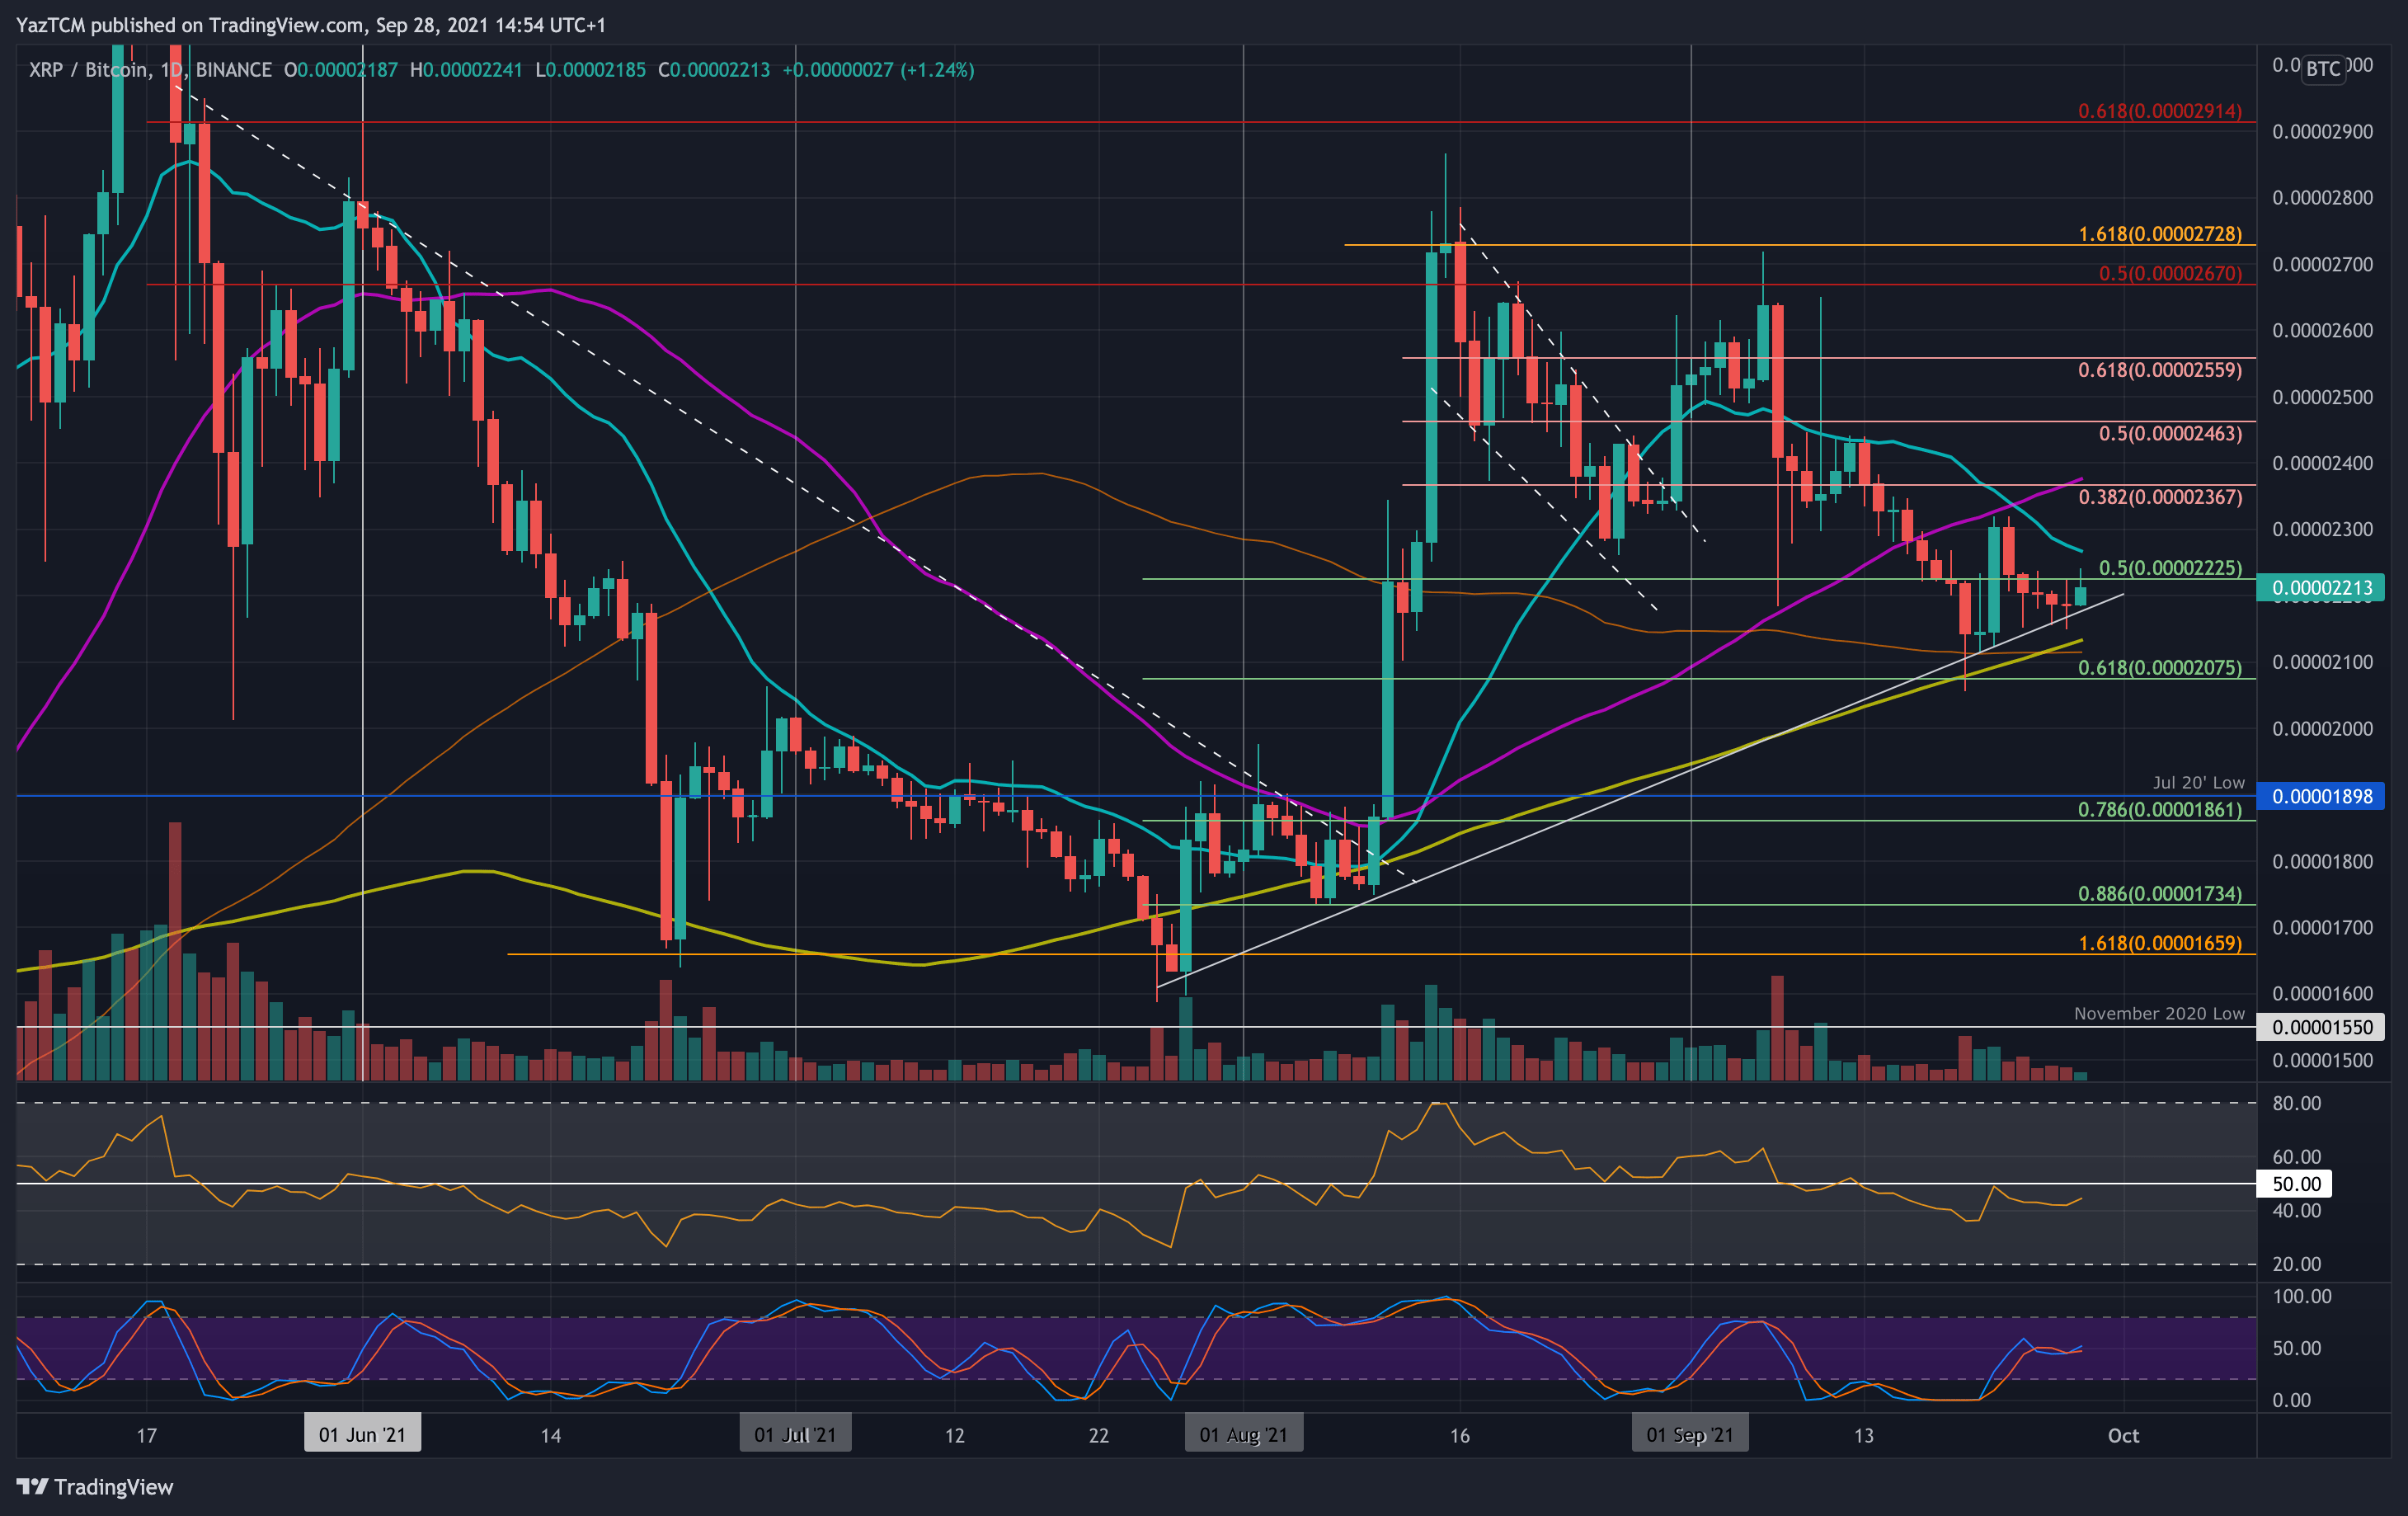
Key Support Levels: 2200 SAT, 2100 SAT, 2000 SAT.
Key Resistance Levels: 2300 SAT, 2370 SAT, 2460 SAT.
XRP has also struggled heavily against BTC in September. The coin fell from above 2600 SAT at the start of the month to reach the current 2200 SAT level.
Last week, the coin fell beneath 2200 SAT but established support at the 100-day MA at around 2100 SAT. A rising trend line also bolstered the support in this area, and XRP has remained above this trend line so far.
Now, XRP must break the current range between 2300 SAT and 2100 SAT to dictate the next market direction.
Looking ahead, the first resistance lies at 2300 SAT. This is followed by 2370 SAT (bearish .382 Fib & 50-day MA0, 2460 SAT (bearish .5 Fib), and 2560 SAT (bearish .618 Fib).
On the other side, the first support lies at the rising trend line (around 2200 SAT). This is followed by 2100 SAT (200-day MA & 100-day MA), 2000 SAT (.618 Fib), and 2000 SAT.
Again, the RSI is marginally beneath the midline, indicating weak bearish momentum.