XRP saw a price decline of around 2% over the past 24 hours and it currently trades at $0.29. This latest decrease is largely due to the fact that BTC fell by 2.10% over the same period. Against Bitcoin, XRP is performing relatively well as it continues to make higher highs during October 2019.
XRP remains the third-largest cryptocurrency with a market cap of $12.57 billion.
Looking at the XRP/USD 1-Day Chart:
- Since our previous XRP/USD analysis, the cryptocurrency made another attempt at the $0.30 level and managed to climb as high as $0.308 before the market rolled over and fell back beneath $0.30.
- From above: The nearest level of resistance lies at $0.30. Above this, resistance lies at $0.308, $0.3177 (200-days EMA), and $0.3262 (bearish .382 Fib Retracement). Higher resistance is expected at $0.3371, $0.35, and $0.3613.
- From below: The nearest level of support lies at $0.2890 (100-days EMA). Beneath this, support is located at $0.2811, $0.27, $0.26, and $0.2584. Further support toward the downside is expected at $0.2518, $0.25, and $0.24.
- The trading volume still remains relatively high when compared with September.
- The RSI is above the 50 level but is slowly fading which could be a sign that the bullish momentum may be fading. Furthermore, the Stocahstic RSI had recently produced a bearish crossover signal which favors the bears.
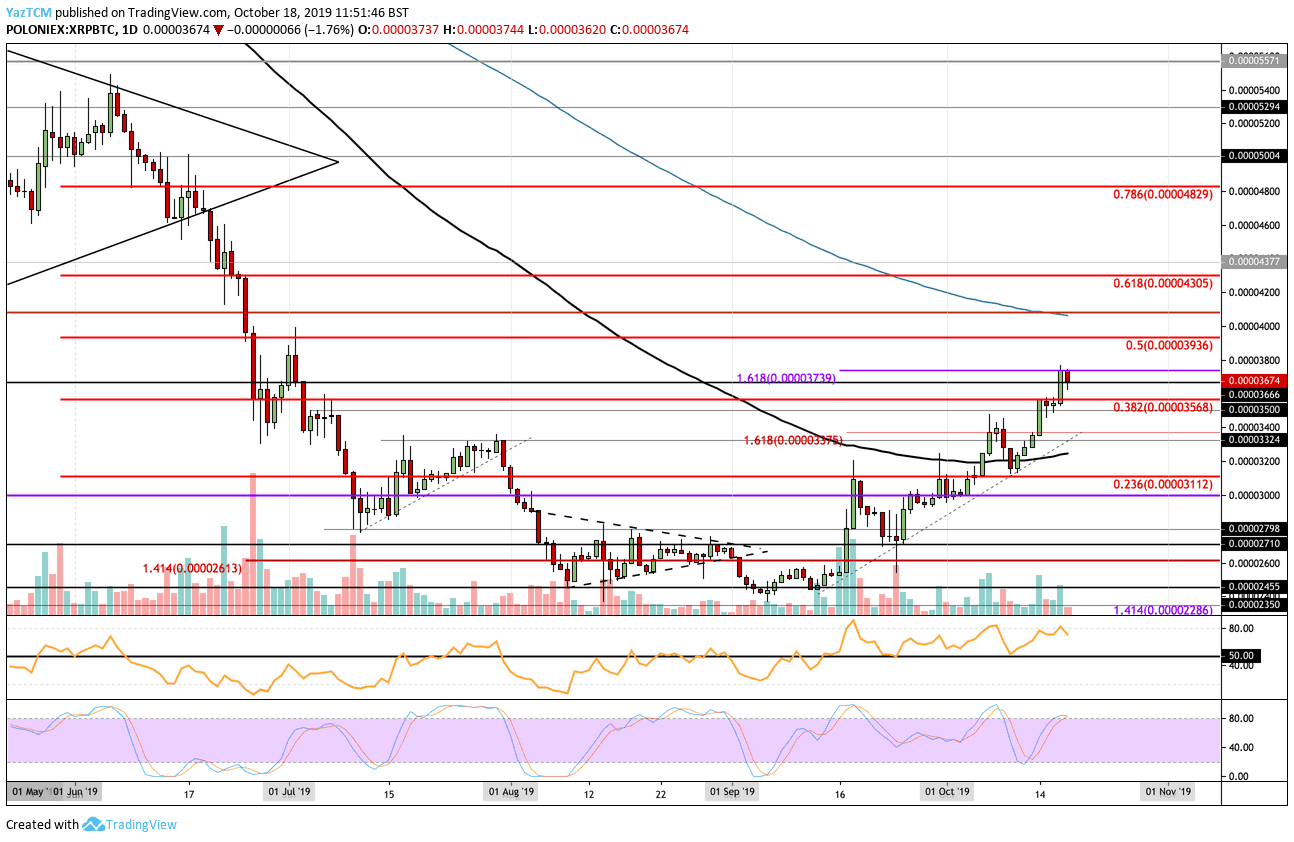
Looking at the XRP/BTC 1-Day Chart:
- Against Bitcoin, XRP managed to smash above the resistance at 3568 SAT. XRP continued to climb higher to reach the current level of resistance at 3739 SAT, provided by a 1.618 Fib Extension.
- From above: The nearest level of resistance lies at 3739 SAT. Above this, resistance lies at 3800 SAT, 3936 SAT (bearish .5 Fib Retracement), 4060 SAT (200-days EMA), and 4305 SAT (bearish .618 Fib Retracement).
- From below: The nearest level of support lies at 3666 SAT. Beneath this, support lies at 3568 SAT, 3500 SAT, 3375 SAT, and 3200 SAT (100-days EMA). Further support can be found at 3112 SAT and 3000 SAT.
- The trading volume remains quite low when compared with September’s volume.
- The RSI is well within the favor of the bulls as it remains well above 50. However, the Stochastic RSI is warning to remain cautious as it is primed for a bearish crossover signal.
SPECIAL OFFER (Sponsored)
Binance Free $600 (CryptoPotato Exclusive): Use this link to register new account and receive $600 exclusive welcome offer on Binance (
full details).
LIMITED OFFER 2024 for CryptoPotato readers at Bybit: Use this link to register and open a $500 BTC-USDT position on Bybit Exchange for free!
Disclaimer: Information found on CryptoPotato is those of writers quoted. It does not represent the opinions of CryptoPotato on whether to buy, sell, or hold any investments. You are advised to conduct your own research before making any investment decisions. Use provided information at your own risk. See Disclaimer for more information.
Cryptocurrency charts by TradingView.