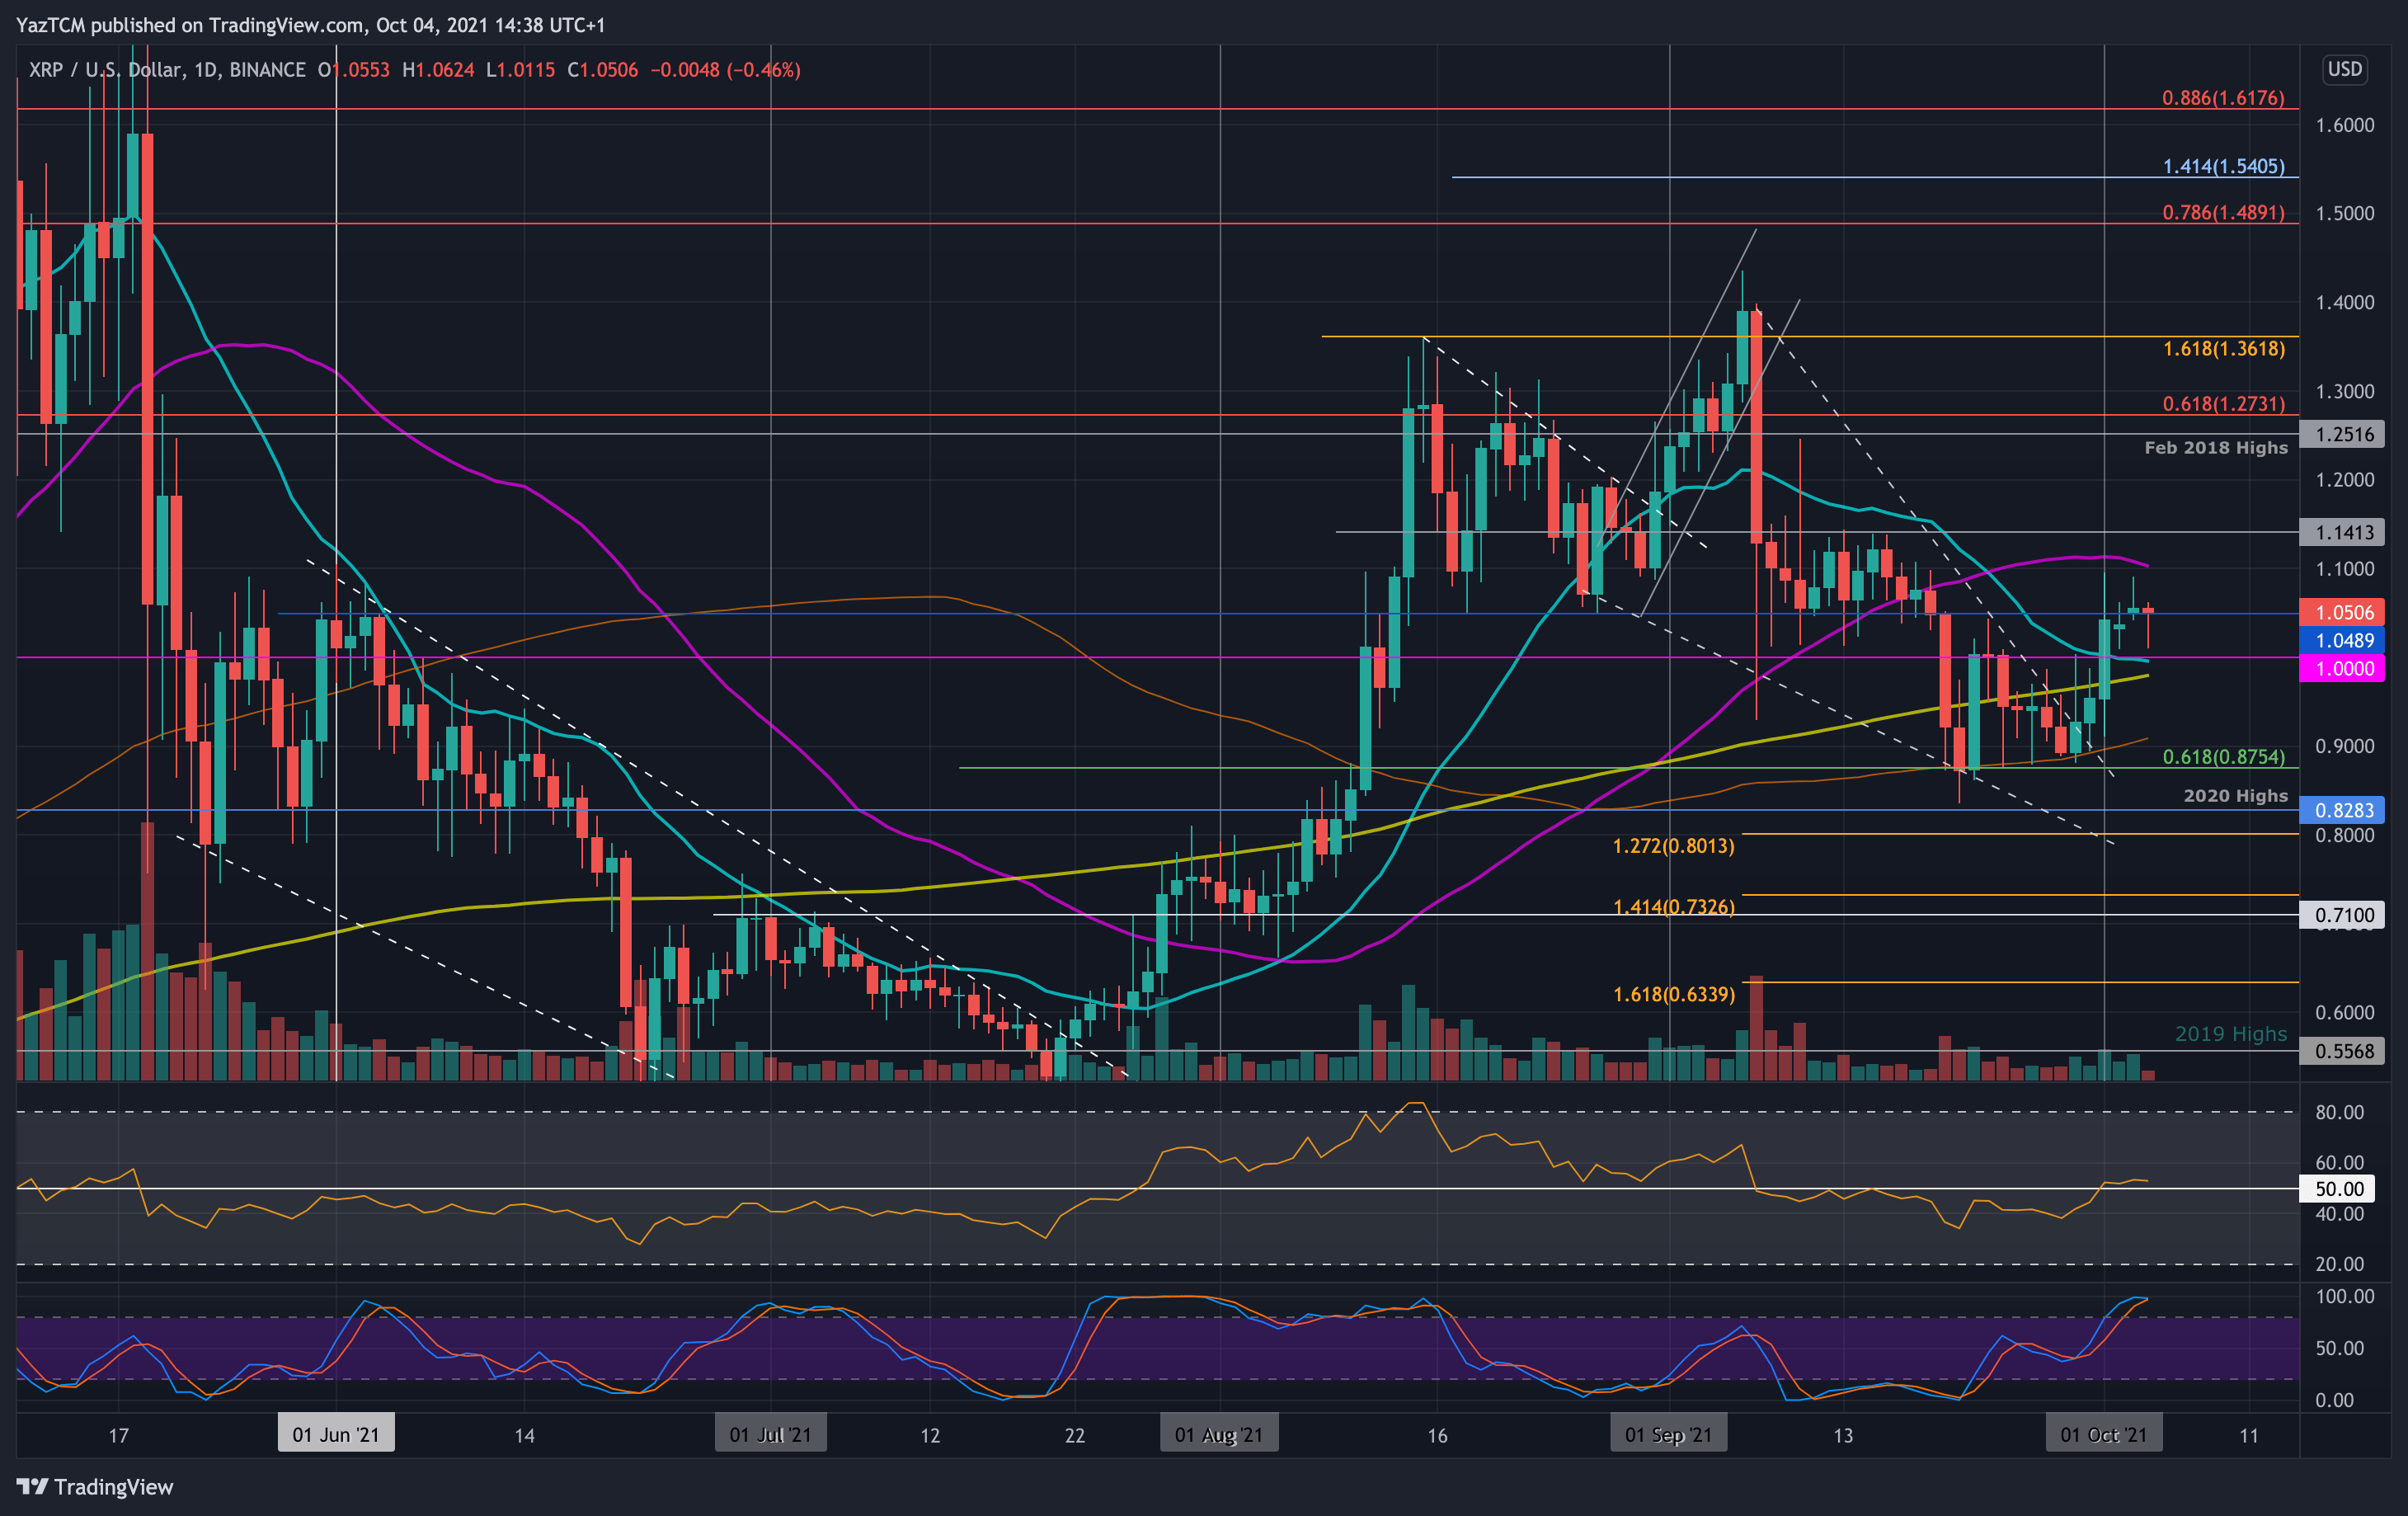
XRP/USD Daily Chart. Source: TradingView.
Key Support Levels: $1.00, $0.9, $0.875.
Key Resistance Levels: $1.10, $1.25, $1.30.
Last week, XRP was trading inside a range between $1.00 and support at $0.875 (.618 Fib). It rebounded from the support on Wednesday, which allowed it to surge back above $1.00 on Friday.
Unfortunately, the cryptocurrency could not pass resistance at $1.10 (50-day MA) over the weekend and has since dropped to $1.05, where it currently trades. A break above $1.10 (50-day MA) would certainly set the stage for the recovery back toward the September highs at $1.40.
Looking ahead, the first resistance lies at $1.10 (50-day MA). This is followed by $1.25, $1.30, $1.40, and $1.50 (bearish .786 Fib).
On the other side, the first support lies at $1.00 (20-day MA). This is followed by $0.9 (100-day MA), $0.875 (.618 Fib), and $0.8282 (2020 highs).
The RSI is marginally above the midline, indicating that the buyers are battling to control the market momentum.
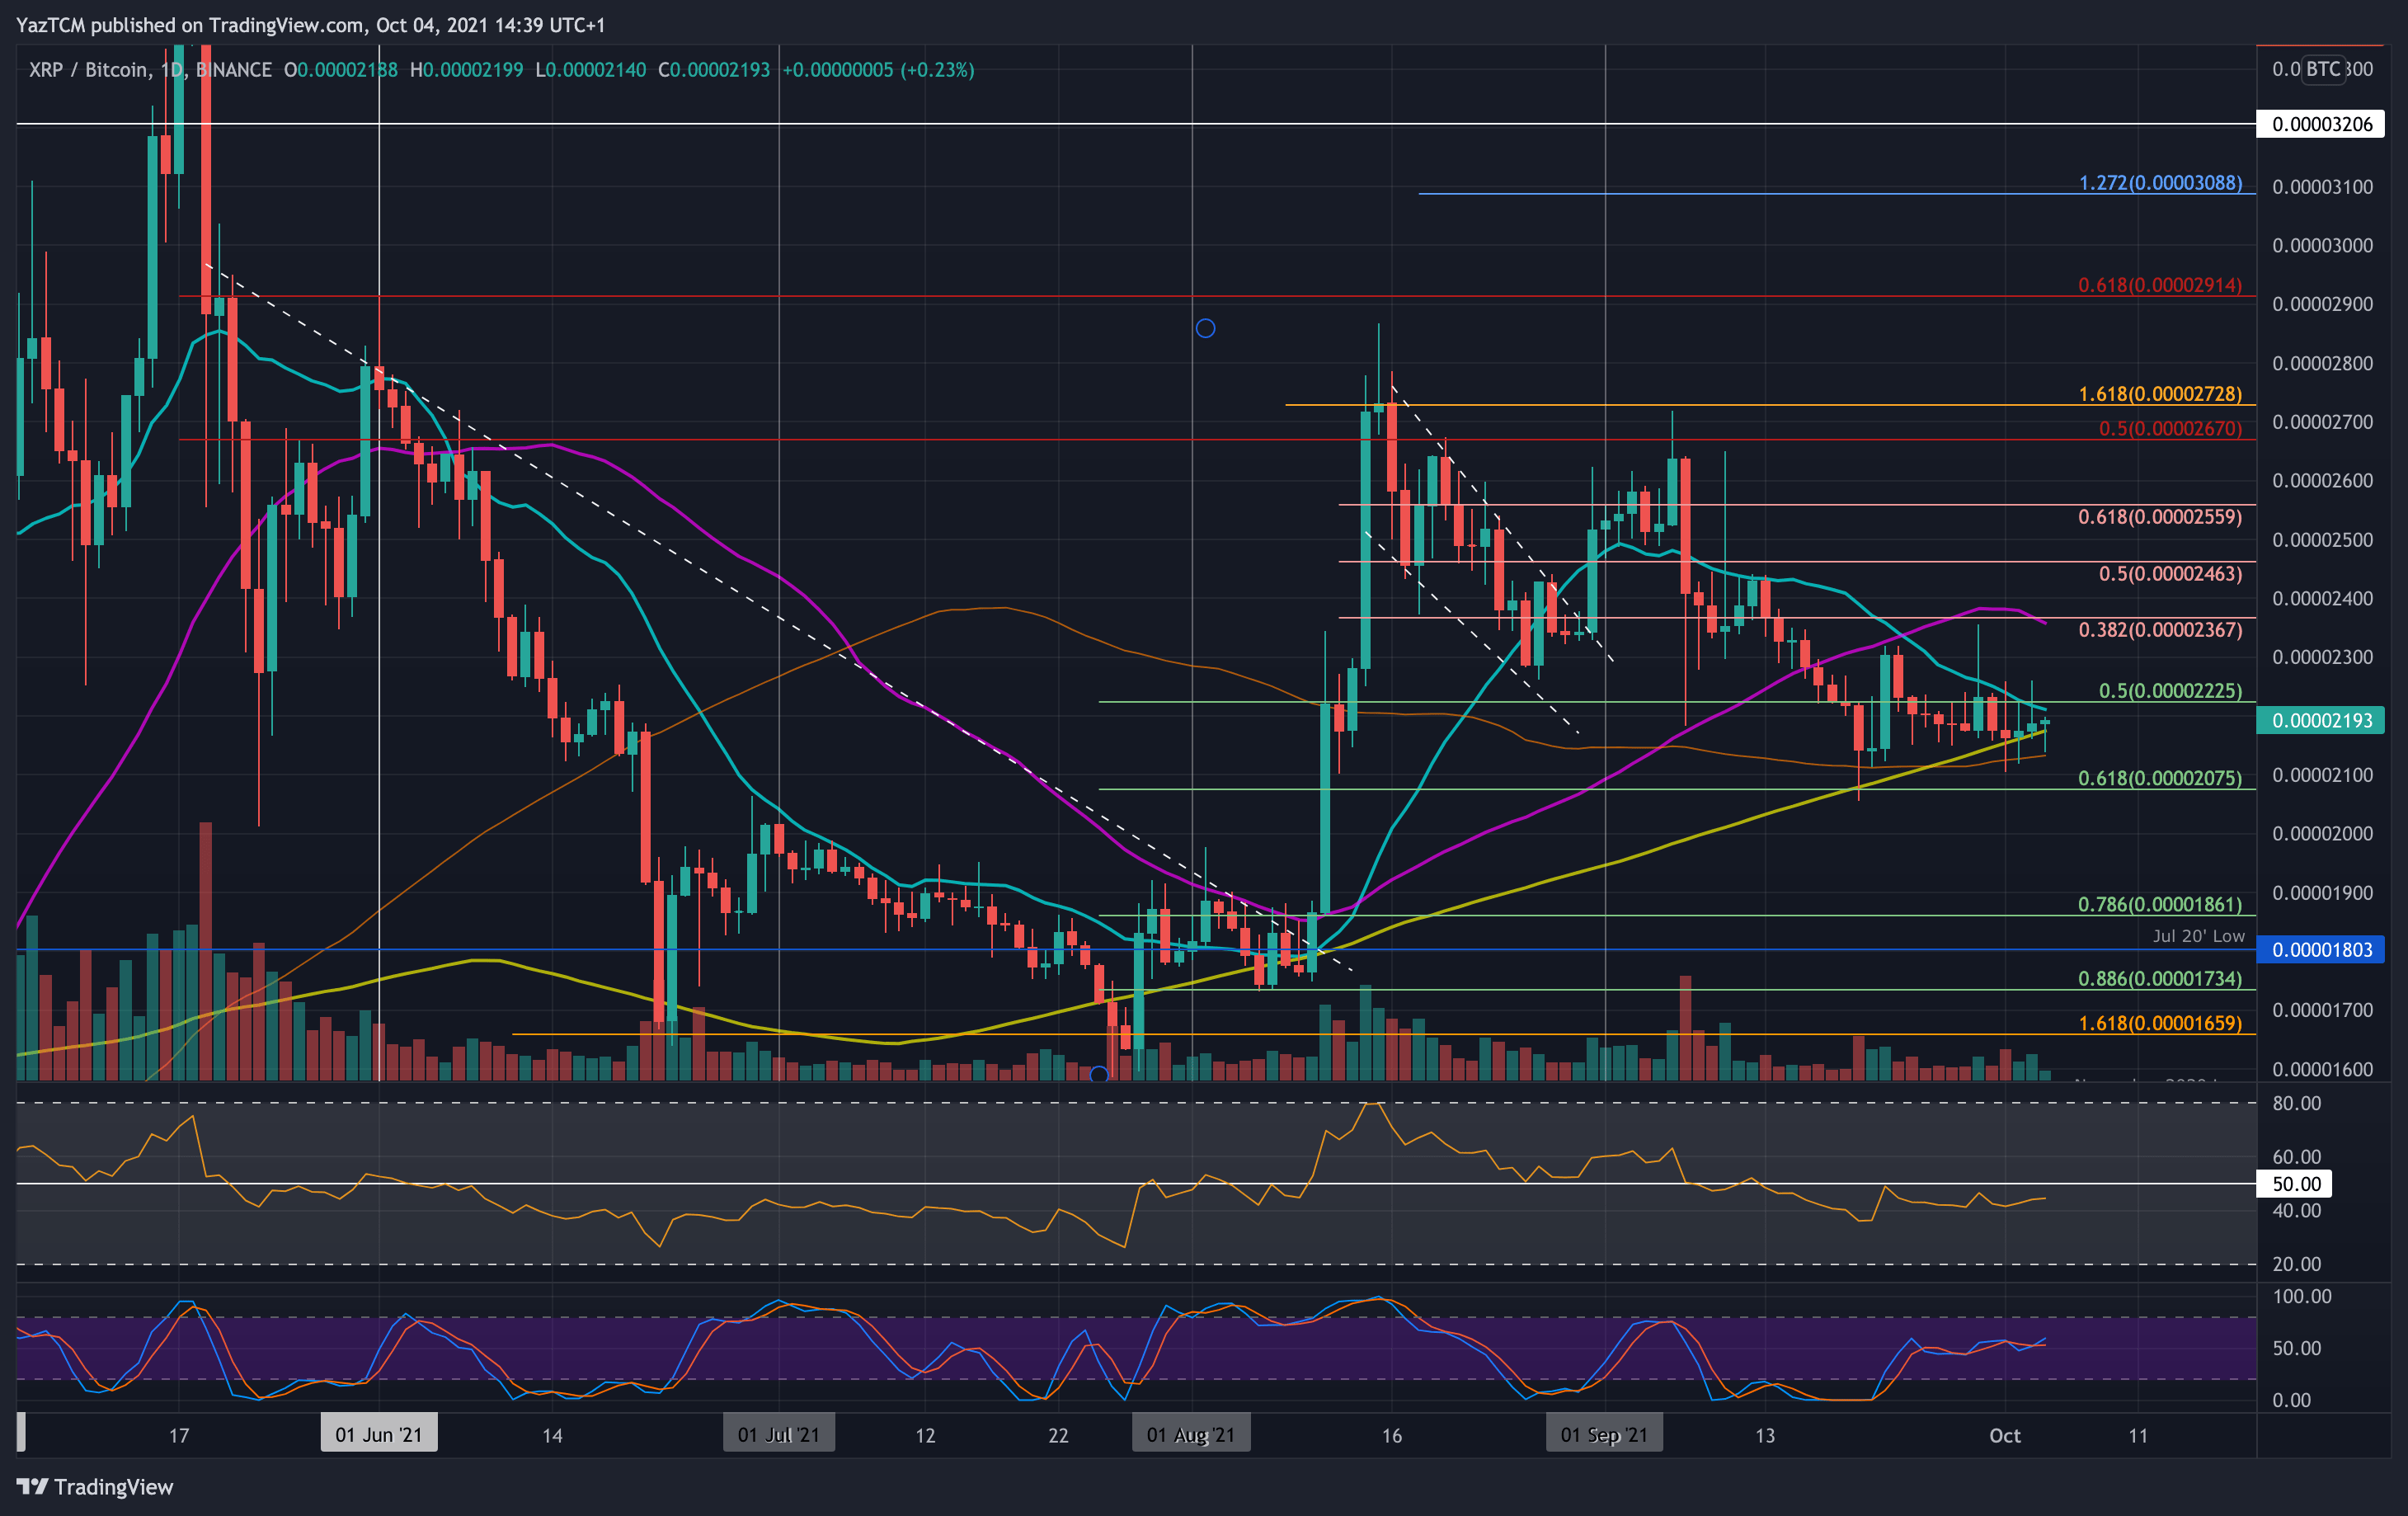
Key Support Levels: 2100 SAT, 2075 SAT, 2000 SAT.
Key Resistance Levels: 2225 SAT, 2300 SAT, 2367 SAT.
Against BTC, XRP is fighting to hold the 200-day MA support at around 2150 SAT. The cryptocurrency dropped as low as 2100 SAT last week, but the 100-day MA there prevents it from sliding lower.
The coin is struck between 2100 SAT and 2300 SAT and must break this range to dictate the next direction for the market.
Looking ahead, the first resistance lies at 2225 SAT (20-day MA). This is followed by 2300 SAT, 2367 SAT (50-day MA & bearish .382 Fib), 2460 SAT (bearish .5 Fib), and 2560 SAT (bearish .618 Fib).
On the other side, the first support lies at 2100 SAT (100-day MA). This is followed by 2075 SAT (.618 Fib), 2000 SAT, and 1860 SAT (.786 Fib).
The RSI remains beneath this midline as the bears control the market momentum.