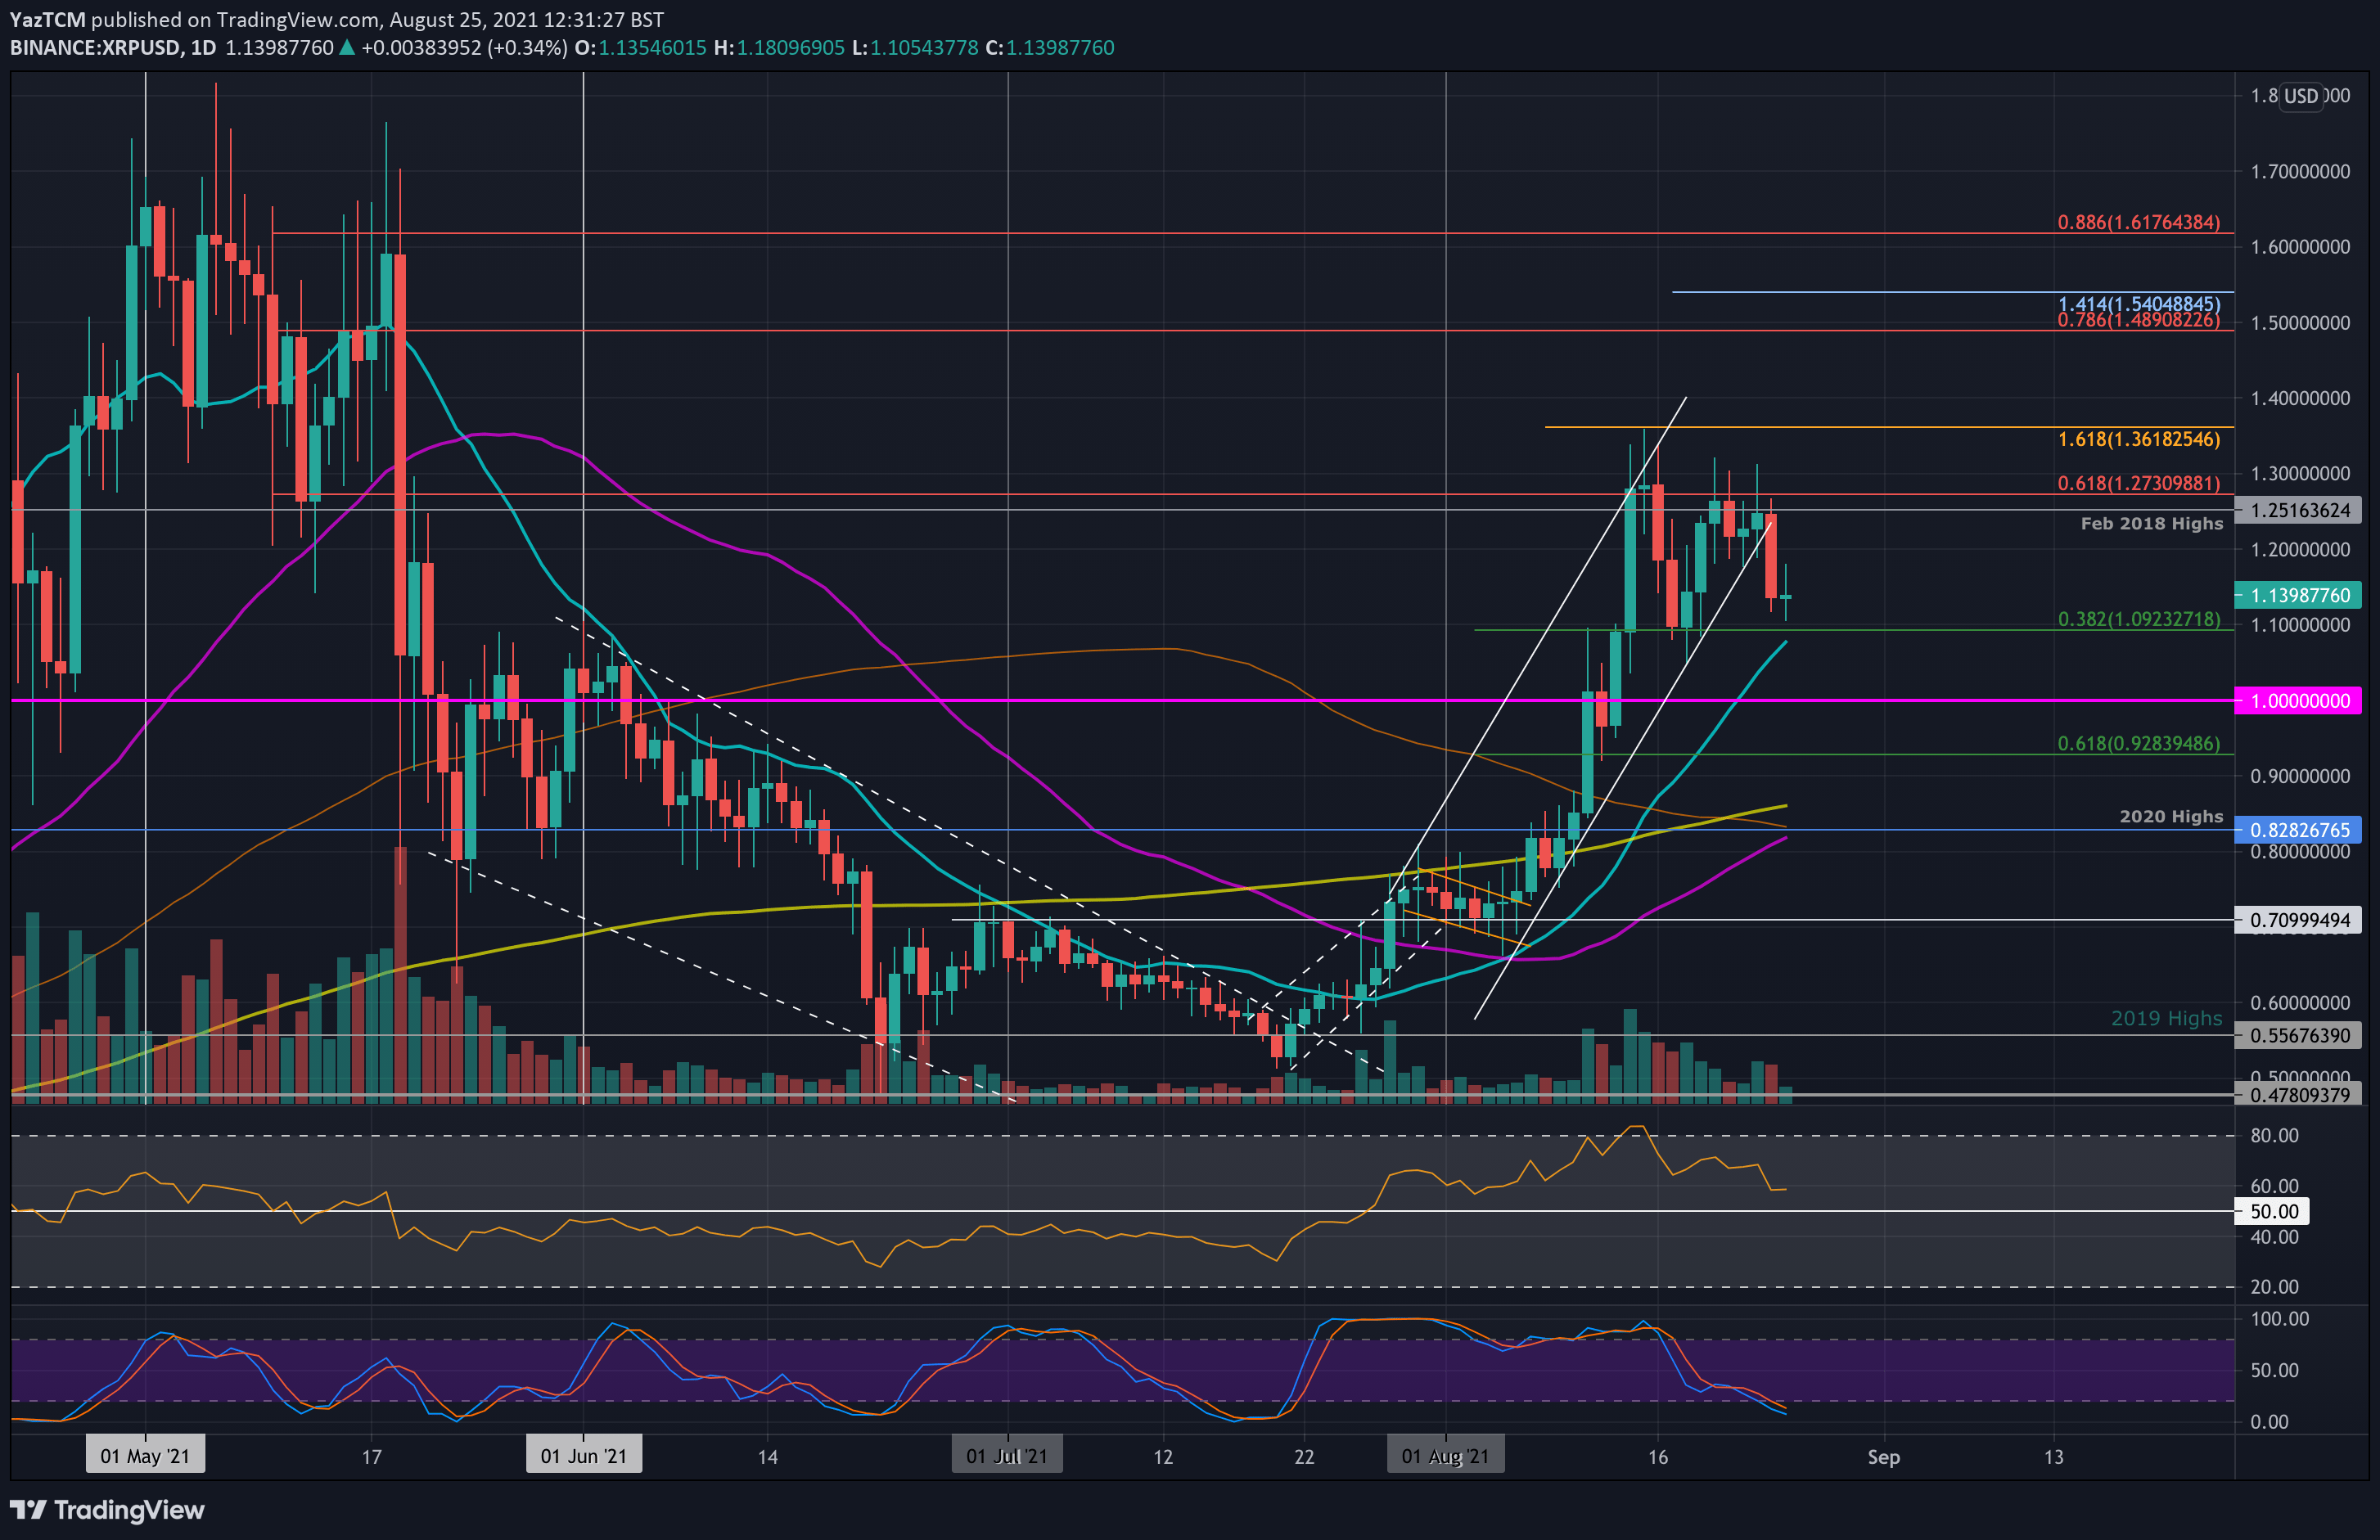
XRP/USD Daily Chart. Source: TradingView.
Key Support Levels: $1.10, $1.00, $0.92.
Key Resistance Levels: $1.25, $1.28, $1.36.
Following the market’s heavy correction, XRP dropped a sharp 8% over the past 24 hours as it fell from the Feb 2018 highs of $1.25 towards the current $1.14 level. The cryptocurrency was trading inside an ascending price channel since the start of August and struggled to break previous resistance at $1.28 (bearish .618 Fib) over the past week.
Today’s reversal caused XRP to break beneath the ascending price channel as it dropped as low as $1.10 over the past hours. If today’s daily candle closes below the price channel, then this breakdown might signal a larger potential short-term downtrend.
Looking ahead, if the sellers push lower, the first support lies around $1.10 (.382 Fib & 20-day MA and today’s low). This is followed by $1.00, $0.92 (.618 Fib), and $0.85 (200-day MA).
On the other side, the first resistance lies at $1.25 (Feb 2018 highs). Next is $1.28 (bearish .618 Fib), $1.36 (August high), and $1.40.
The RSI is heading lower, indicating the previous bullish momentum from the past month is fading. However, it is still not at the midline, and the bears are still not in control of the market momentum.
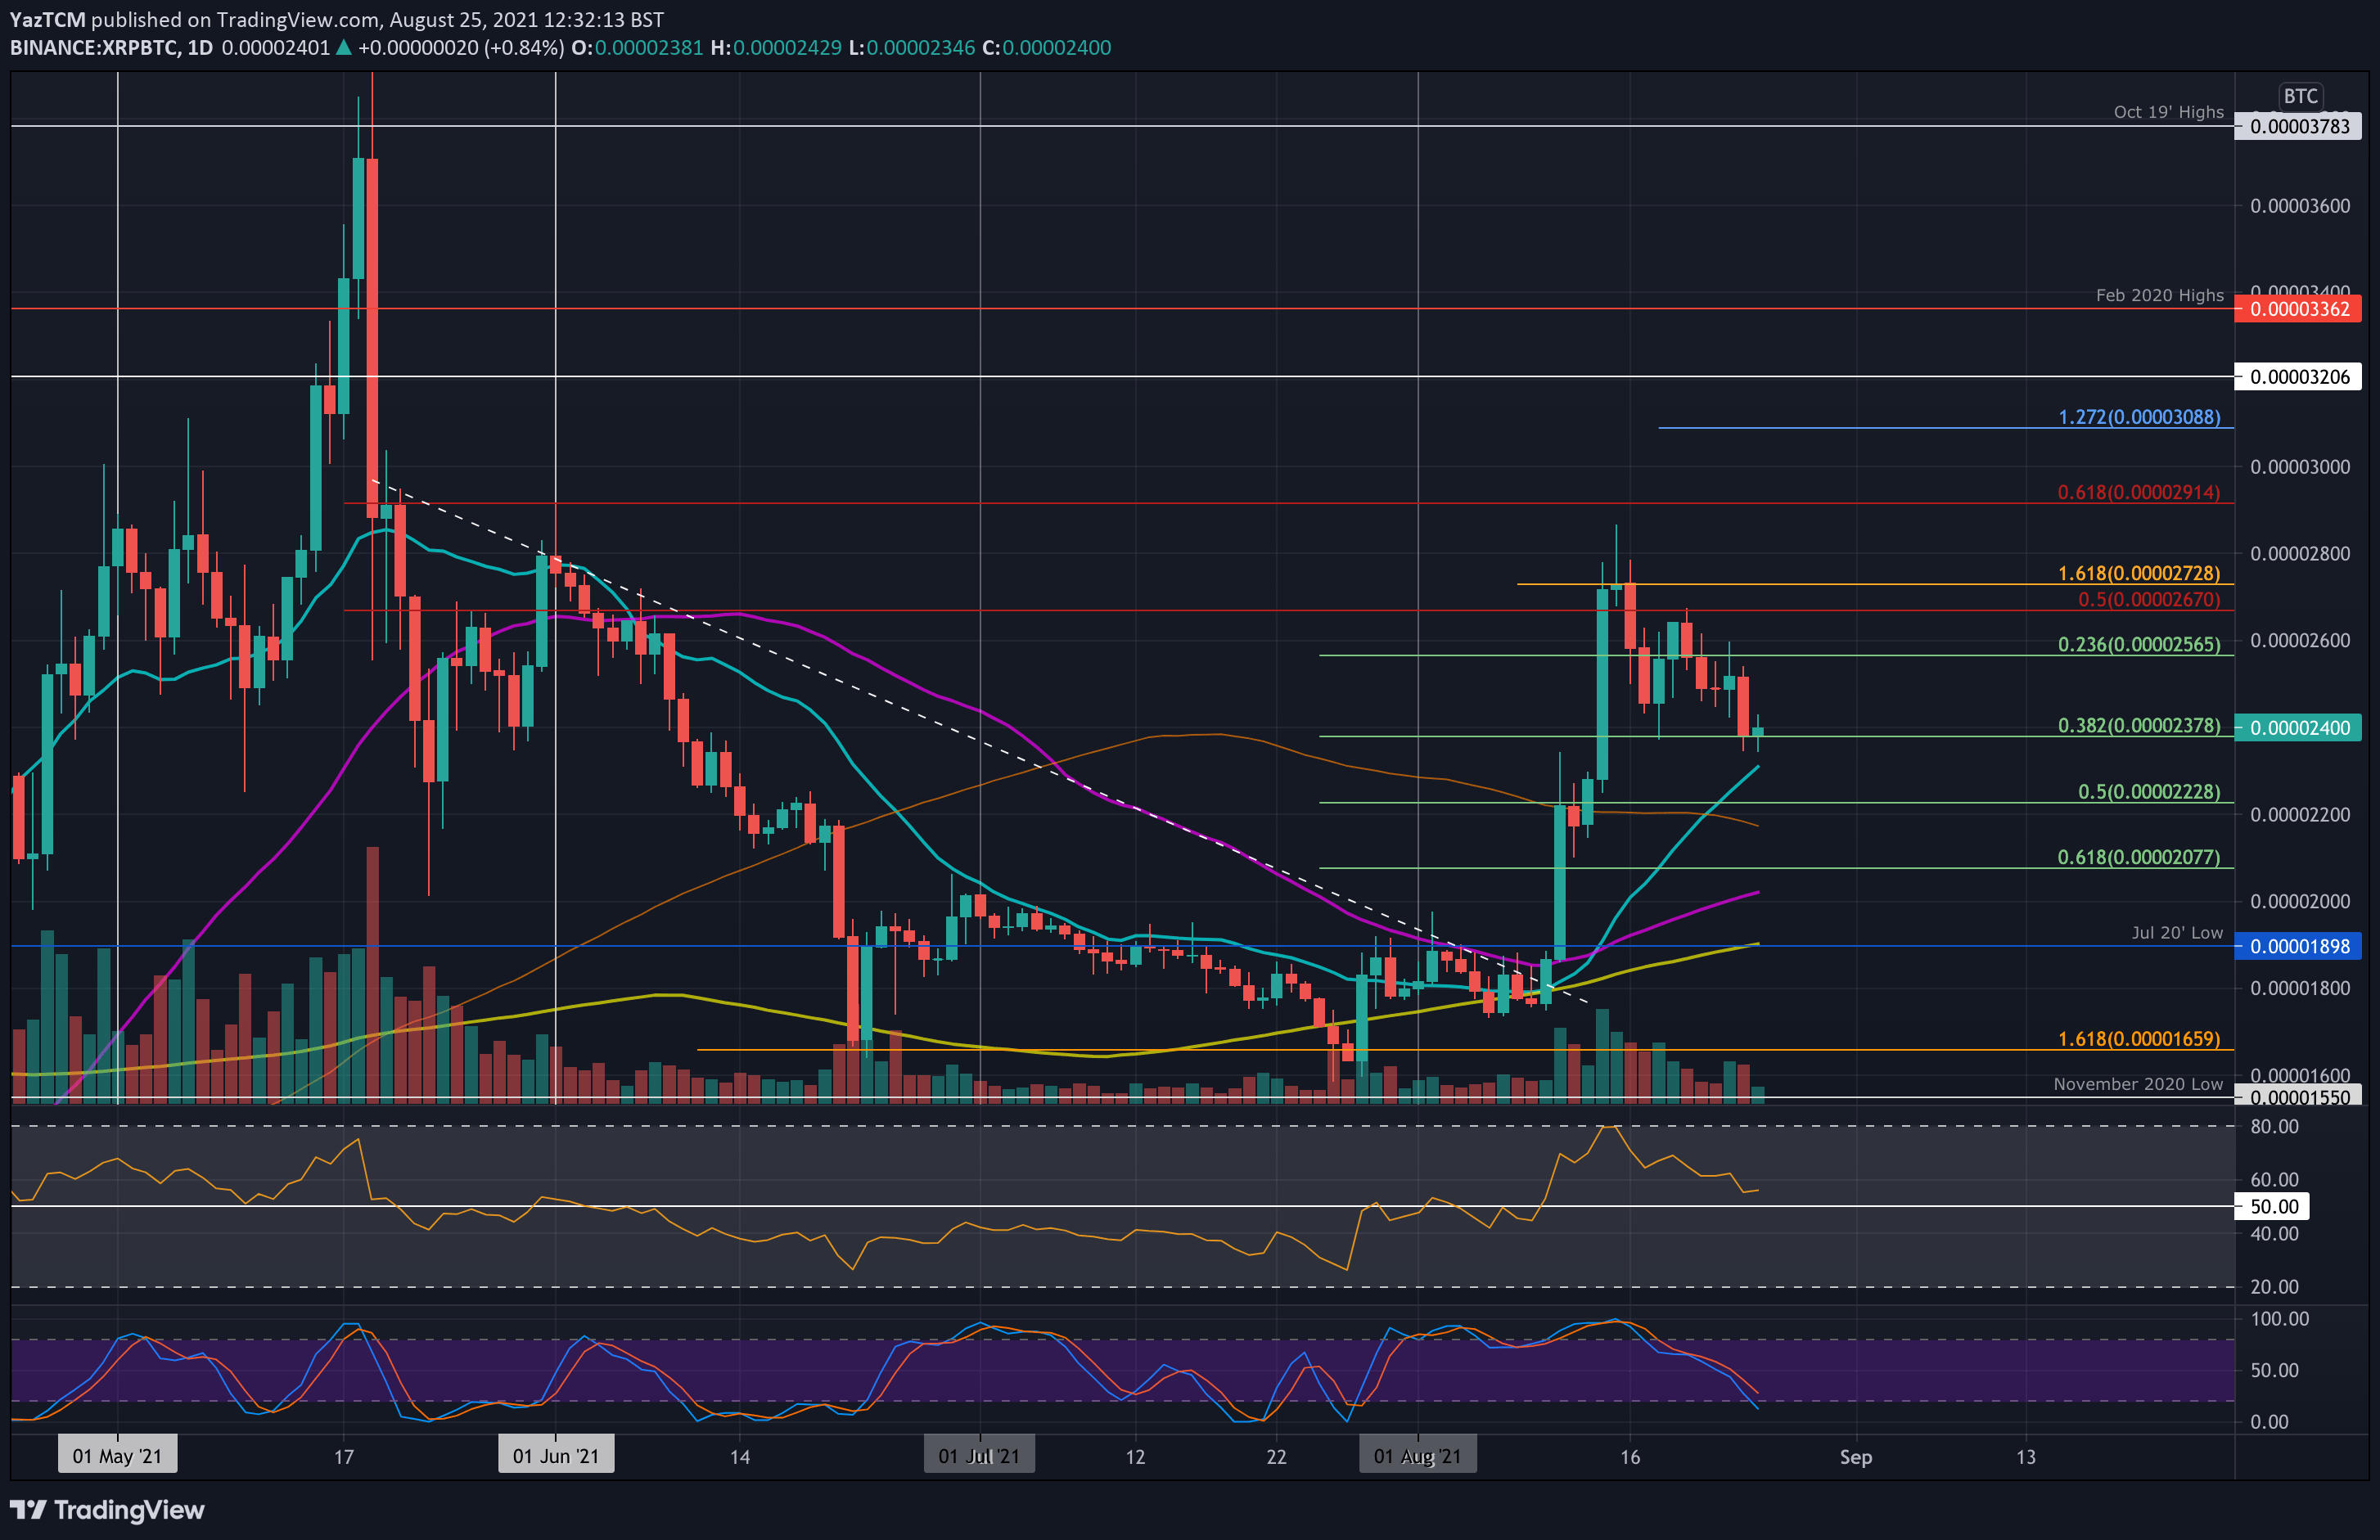
Key Support Levels: 2380 SAT, 2310 SAT, 2230 SAT.
Key Resistance Levels: 2500 SAT, 2600 SAT, 2670 SAT.
XRP also dropped yesterday against BTC to find the support at a .382 Fib retracement level around 2380 SAT. On Friday, XRP/BTC struggled to break resistance at 2670 SAT (bearish .5 Fib) and headed lower over the weekend as it fell beneath 2600 SAT.
A daily closing candle beneath the .382 Fib support would signal the first lower-low, which would signal a short-term downtrend forming for XRP – also against BTC.
Looking ahead, the first support lies at 2380 SAT (.382 Fib). This is followed by 2310 SAT (20-day MA), 2230 SAT (.5 Fib), and 2175 SAT (200-day MA).
On the other side, the first resistance lies at 2500 SAT. 2600 SAT is next, followed by 2670 SAT (bearish .5 Fib), and 2730 SAT (1.618 Fib Extension).
Same as against the USD, also for the BTC pair, the daily RSI is heading lower, indicating that the previous bullish momentum is fading. However, it is still yet to dip beneath the midline, suggesting the sellers are not controlling the momentum (yet).