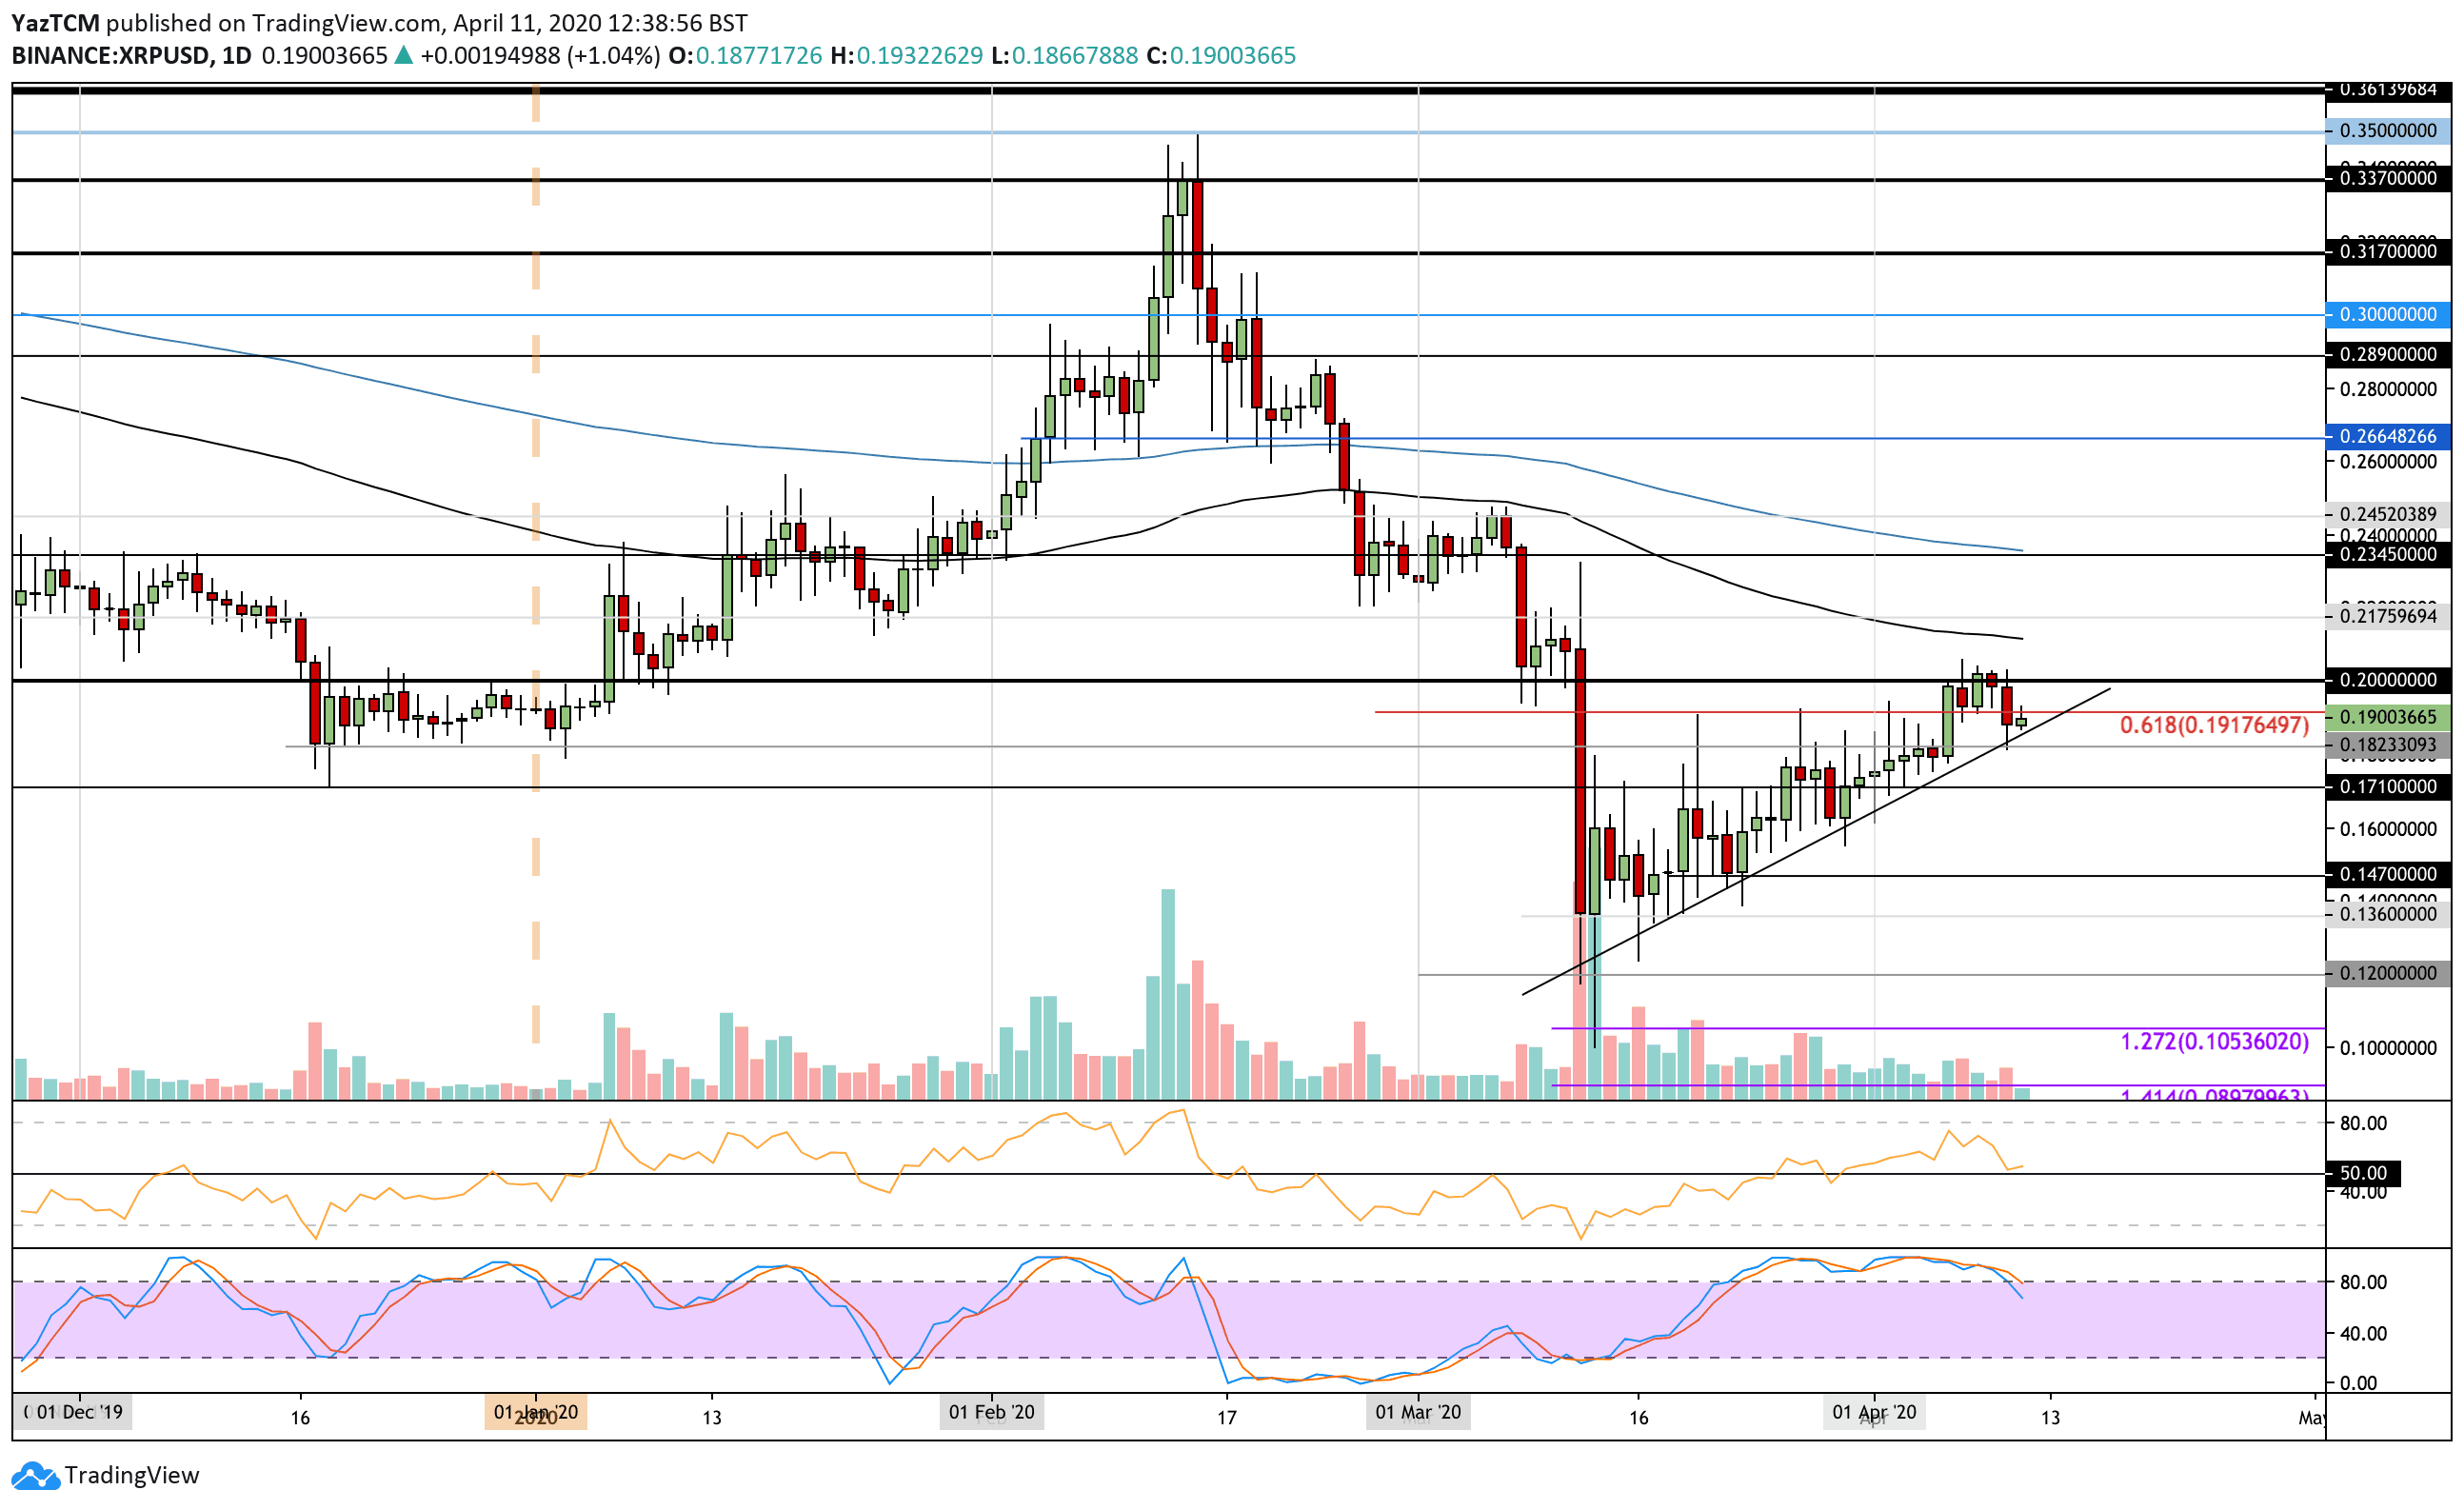
XRP/USD:
Support: $0.182, $0.171, $0.16.
Resistance: $0.2, $0.215, $0.22.
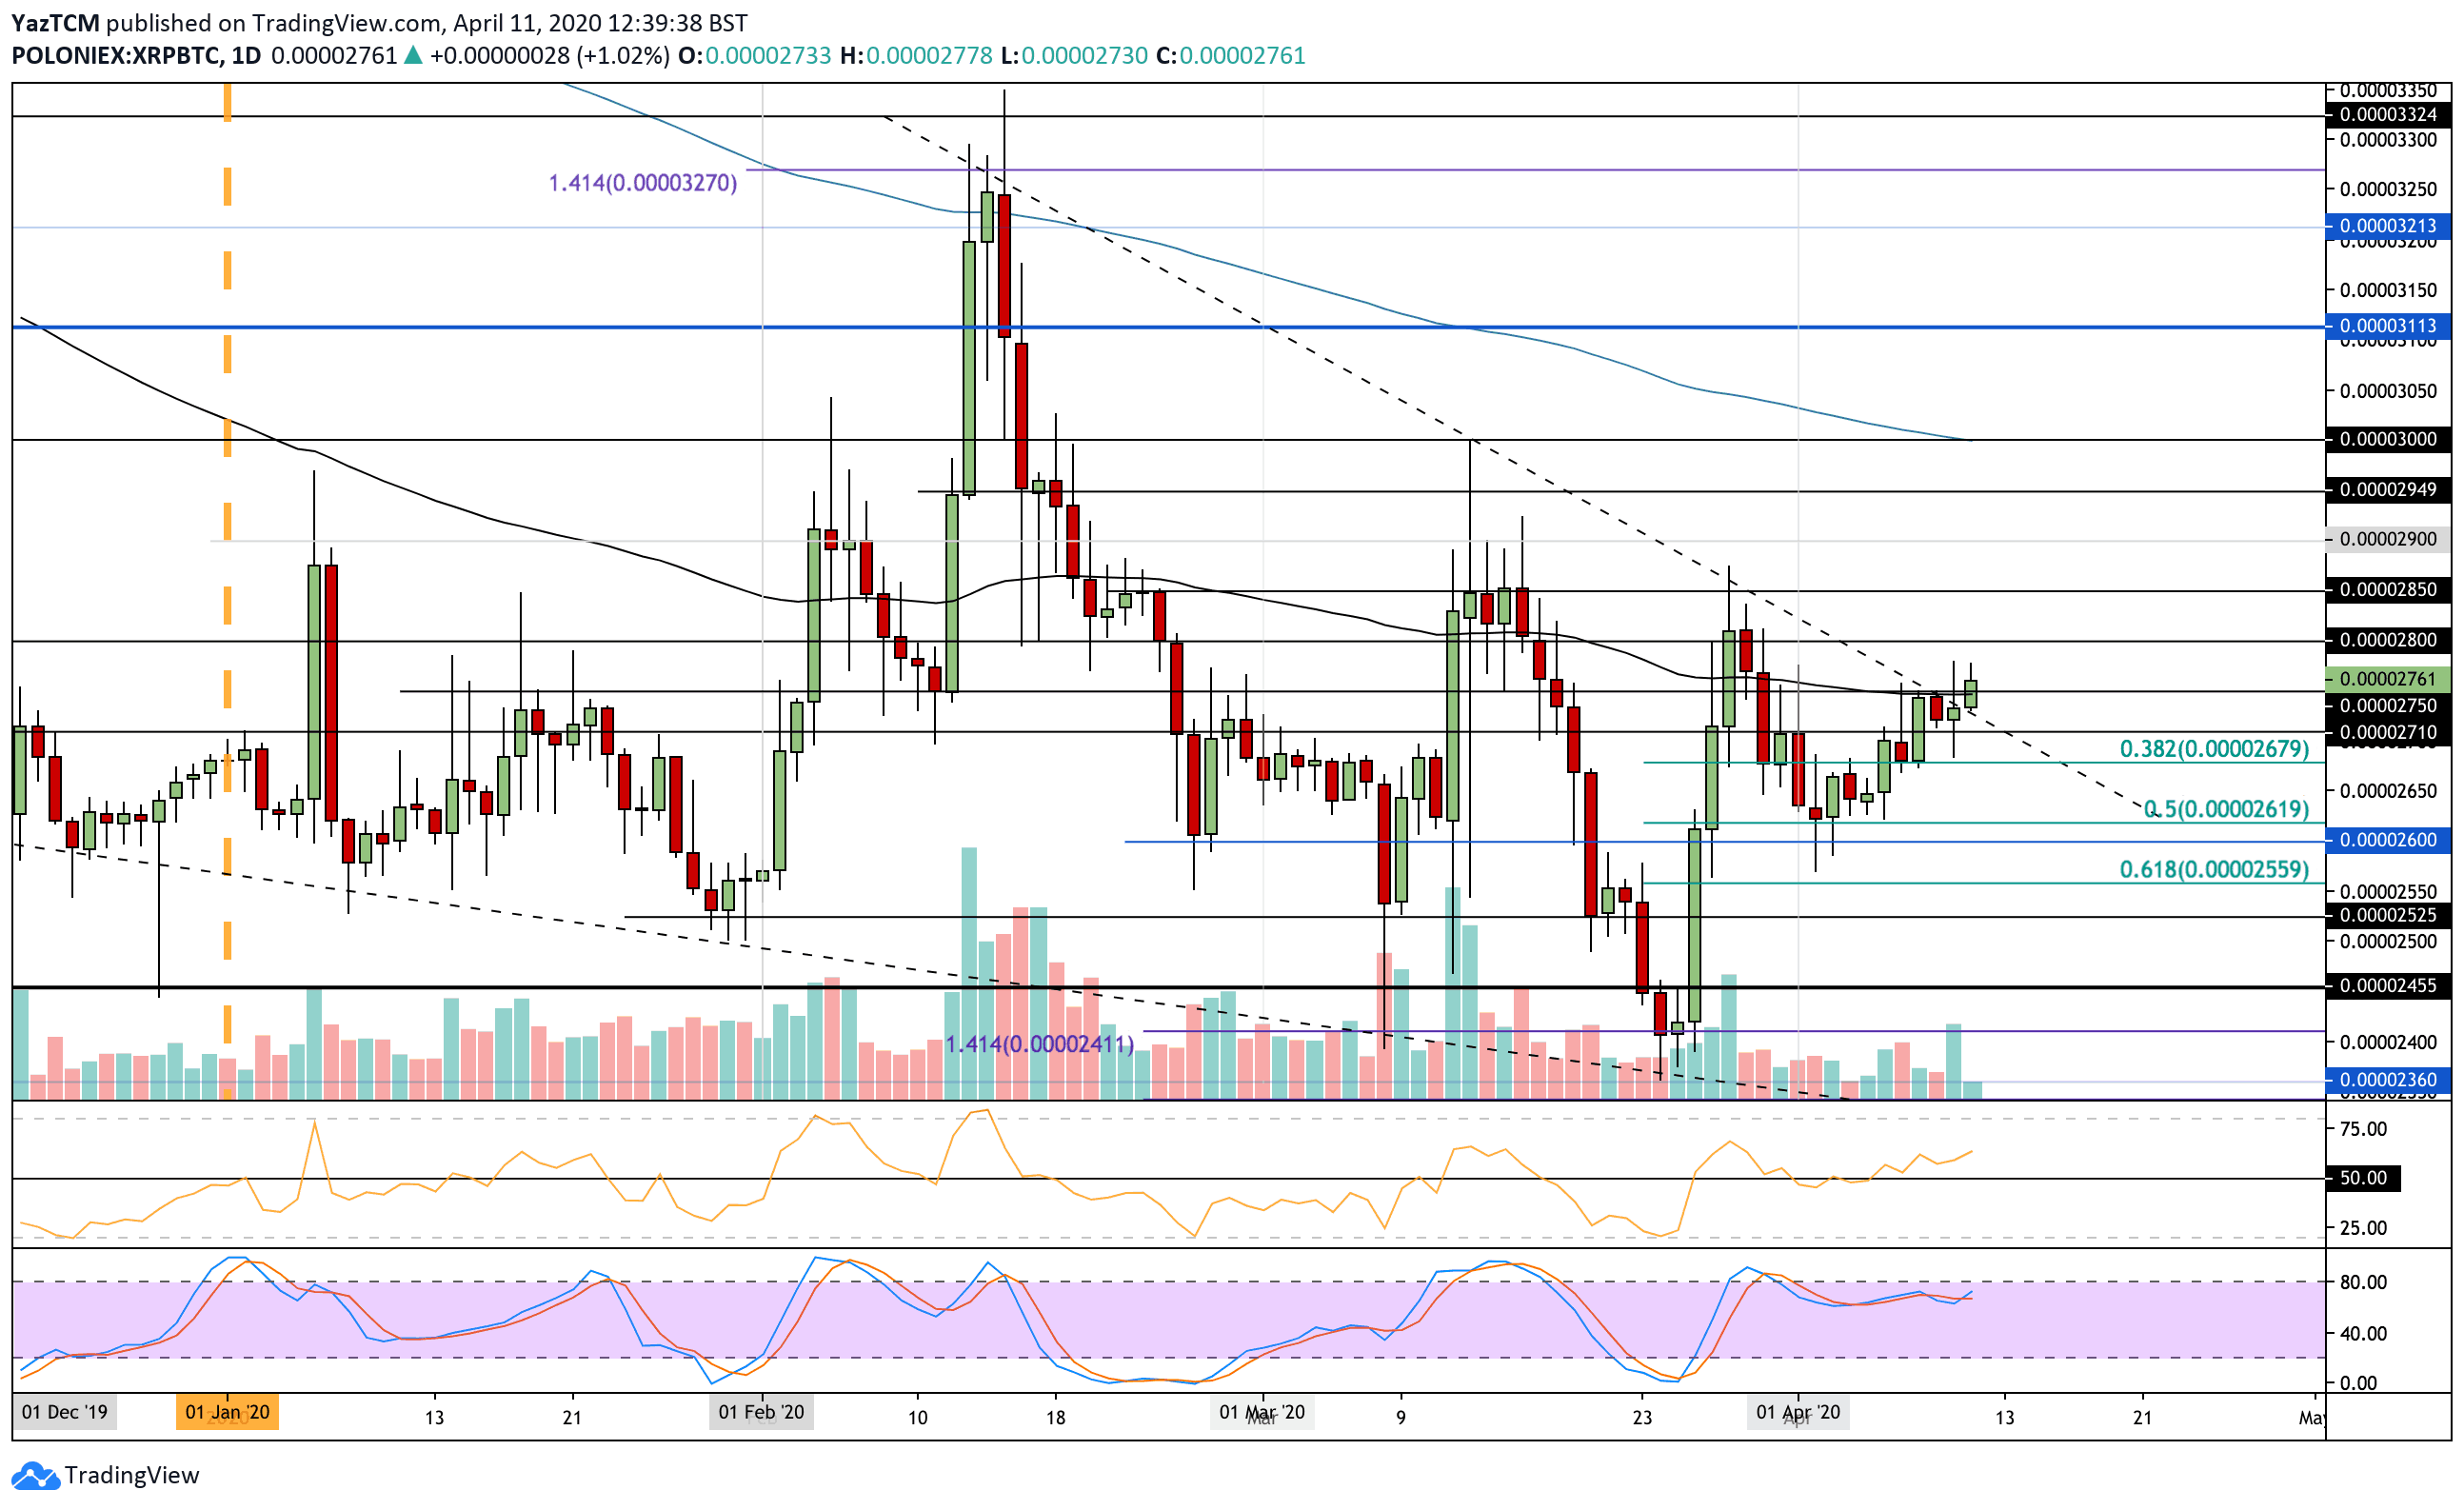
XRP/BTC:
Support: 2750 SAT, 2710 SAT, 2680 SAT.
Resistance: 2800 SAT, 2850 SAT, 2900 SAT.
XRP climbed as high as $0.20 this week. However, it was unable to overcome this resistance, which caused it to fall into the $0.182 level. It had found support at a rising trend line that has been in action since the March market collapse.
The cryptocurrency is now slightly below $0.19 but still faces the strong resistance at $0.2 before being able to climb higher.
If the bulls can break the resistance at $0.2, higher resistance lies at $0.212 (100-days EMA), $0.22, and $0.234 (200-days EMA).
On the other side, if the sellers push beneath the rising trend line, support lies at $0.182, $0.171, and $0.16.
The RSI is in a rebound from the 50 level as the bulls attempt to retain control of the market momentum. If it can continue to rise from here, XRP will have the momentum to make another attempt at $0.2.
Against Bitcoin, XRP had been struggling with the resistance at the 100-days EMA at 2750 SAT but recently managed to overcome this level today.
XRP also managed to break above a 2-month-old falling trend line that had trapped the cryptocurrency from climbing higher. If it can close above this level, this will help to start a rally higher toward 3000 SAT for XRP.
From above, the first level of resistance lies at 2800 SAT. Above this, resistance lies at 2850 SAT, 2900 SAT, and 3000 SAT (200-days EMA).
From below, the first level of support lies at 2750 SAT (100-days EMA). Beneath this, added support lies at 2710 SAT, 2680 SAT (.382 Fib Retracement), 2620 SAT (.5 Fib Retracement), and 2600 SAT.
The RSI is still well above the 50 level and is rising, which shows that the bullish momentum is growing. This is a good sign that XRP should close above this 2-month-old falling trend line.