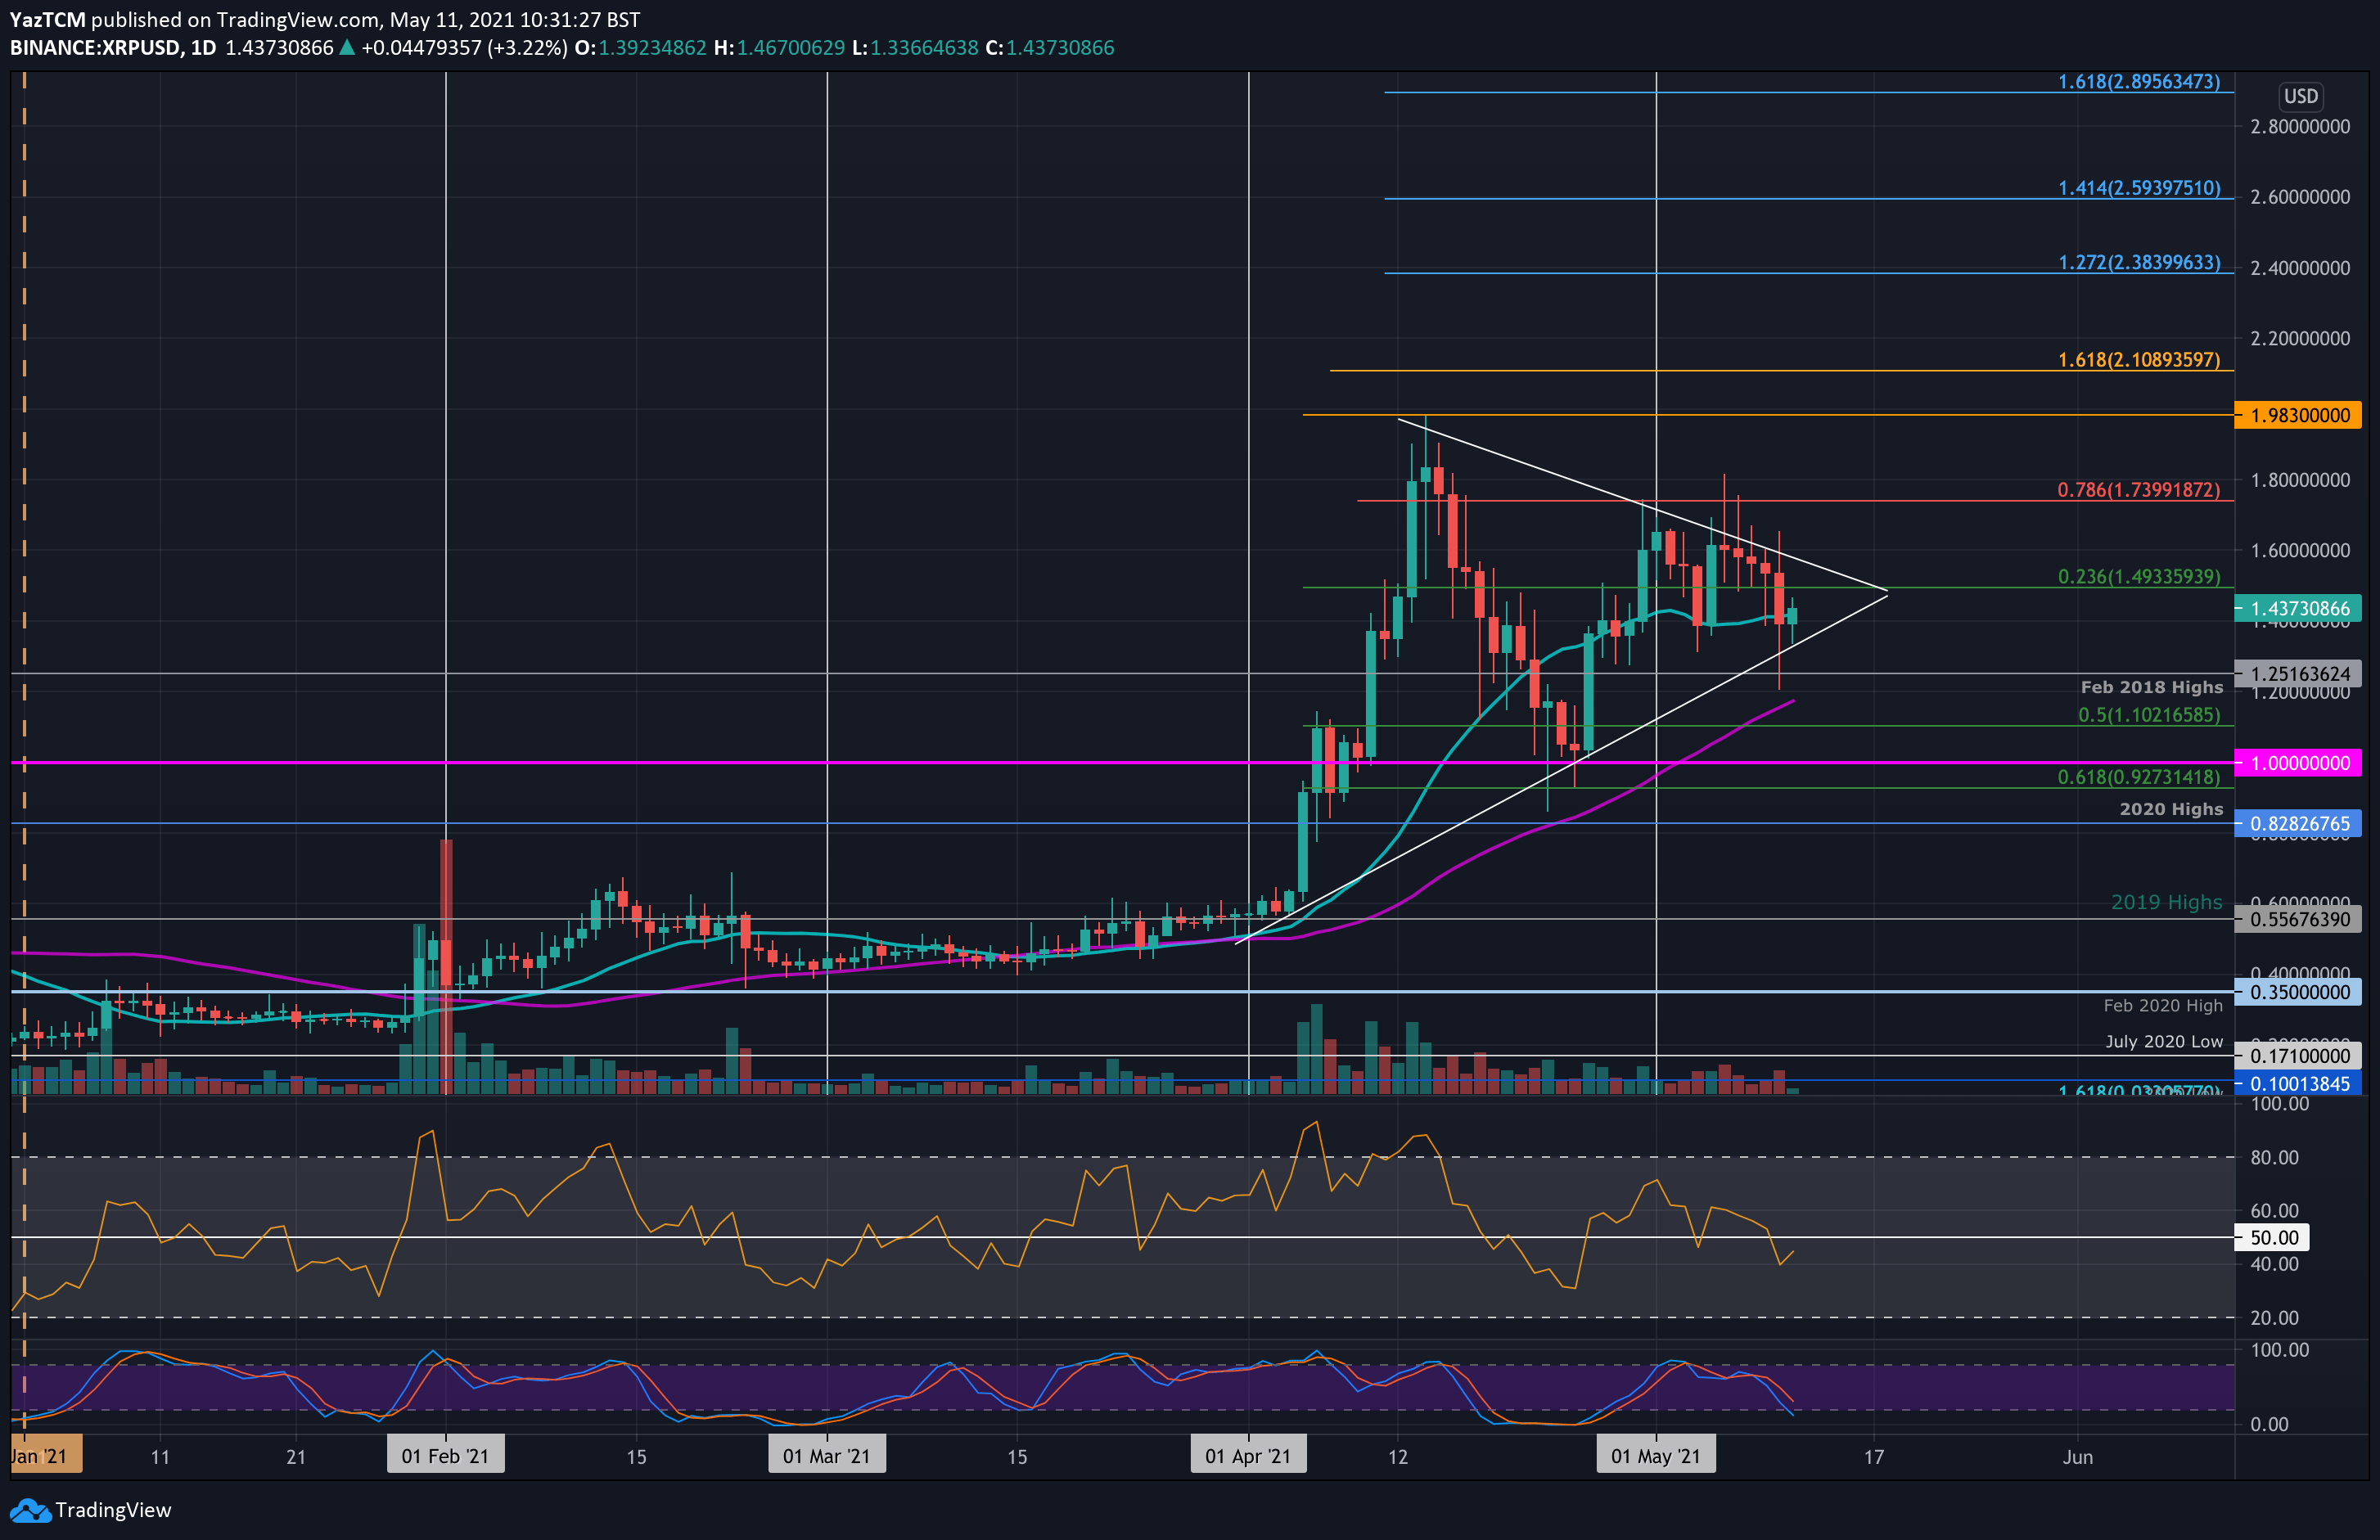
XRP/USD Daily Chart. Source: TradingView
Key Support Levels: $1.40, $1.25, $1.10.
Key Resistance Levels: $1.60, $1.74, $1.98.
XRP managed to spike above $1.80 last week but eventually closed the daily candle beneath $1.60. It has struggled to break above the upper angle of a symmetrical triangle pattern that it has been trading in for the past fortnight.
Since spiking above $1.80, XRP has closed each daily candle beneath the upper boundary of the symmetrical triangle pattern. Yesterday, it fell from $1.60 to reach as low as $1.20. By the end of the day, XRP had recovered to $1.40 and remained inside the triangle. It continues to battle to stay above $1.40 today.
Looking ahead, the first resistance lies at $1.50. This is followed by the upper boundary of the triangle. Beyond the triangle, resistance lies at $1.60, $1.74 (bearish .786 Fib), $1.98 (2021 highs), and $2.10 (1.618 Fib Extension).
On the other side, the first support lies at the lower boundary of the triangle. Beneath this, added support lies at $1.25 (Feb 2018 highs), $1.20 (May lows & 50-days MA), $1.10 (.5 Fib), and $1.00.
The RSI slipped beneath the midline today, indicating the bears are in control of the market momentum.
Key Support Levels: 2465 SAT, 2263 SAT, 2050 SAT.
Key Resistance Levels: 2877 SAT, 3000 SAT – 3110 SAT, 3360 SAT.
XRP is also showing signs of struggling against BTC this week. The coin spiked to a new 2021 high of 3110 SAT last week but failed to close a daily candle above resistance at 2877 SAT (bearish .618 Fib).
From there, it headed lower over the past 5-days and spiked as low as 2263 SAT (.382 Fib) yesterday. A month-old trend line further bolstered this level. Luckily, XRP recovered above 2462 SAT (short term .5 Fib) by the end of the day and pushed higher from there today to reach 2583 SAT.
Looking ahead, the first strong resistance lies at 2877 SAT. This is followed by 3000 SAT, 3110 SAT (2021 highs), and 3362 SAT (Feb 2020 highs).
On the other side, the first support lies at 2462 SAT (short-term .5 Fib). This is followed by the rising trend line, 2263 SAT (.382 Fib), 2050 SAT (100-days MA), and 2000 SAT (.5 Fib).
The RSI is trading at the midline here as the bulls battle to regain the market momentum.