XRP saw a price increase of around 1% over the past 24 hours and it currently trades at $0.2926. The cryptocurrency has been on a tear these past two weeks after surging by a total of 17.72%, making it the strongest performing cryptocurrency out of the top 5 in the selected period.
The surge has now allowed XRP to retest the $0.30 level which had provided strong support for the market all year until it was broken in July 2019. This price increase is largely a result of XRP surging against BTC as it broke above 3400 SATS.
XRP remains the third-largest cryptocurrency with a market cap of $12.62 billion.
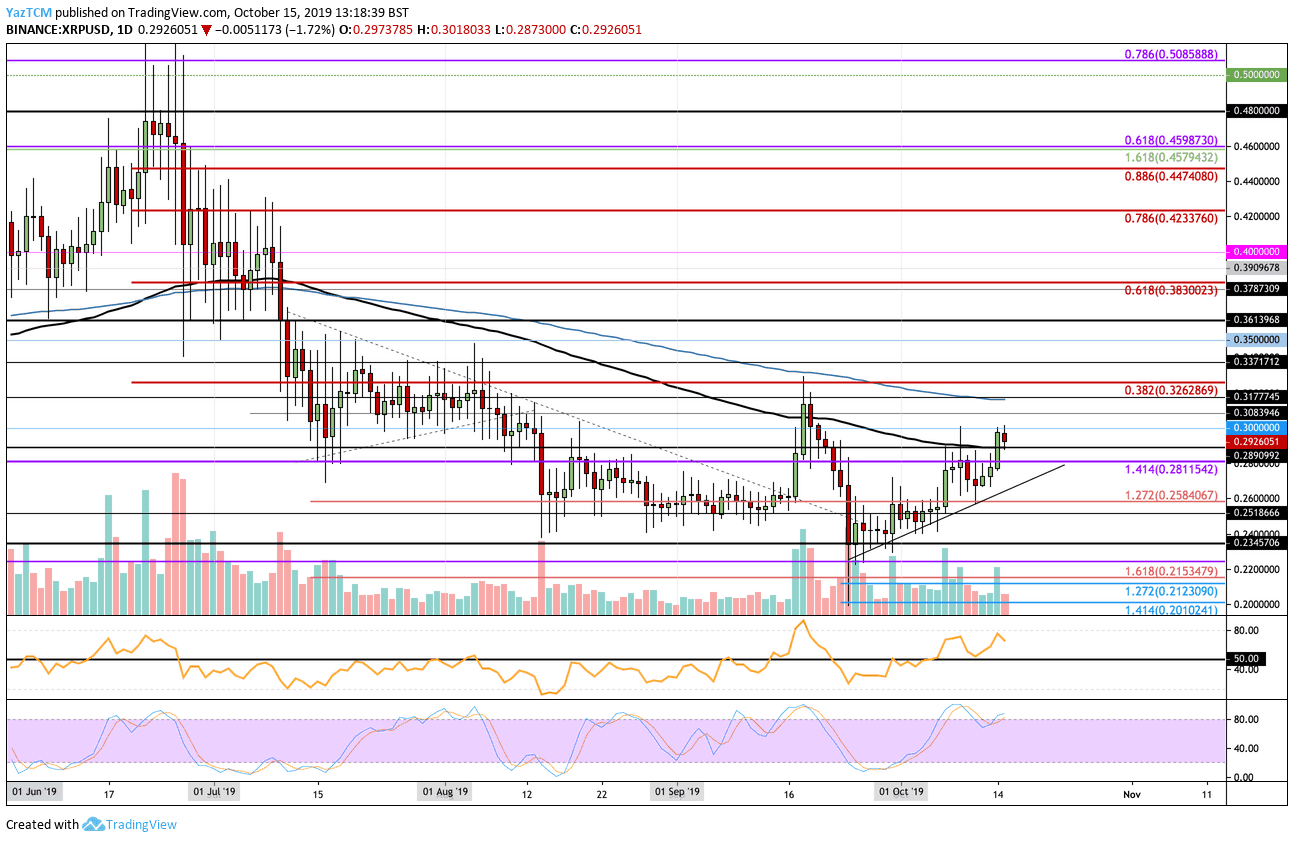
Looking at the XRP/USD 1-Day Chart:
- Since our previous XRP/USD analysis, the cryptocurrency continued to climb above the resistance at $0.2811. It went higher, breaking above the 100-days EMA at $0.2890 to meet resistance at the $0.30 level.
- From above: The nearest level of resistance lies at $0.30. Above $0.30, resistance lies at $0.308 and $0.3177 (200-days EMA). Higher resistance is found at $0.3262 (bearish .382 Fib Retracement), $0.3371, $0.35, and $0.3613.
- From below: The nearest level of support lies at $0.2890 (100-days EMA). Beneath this, support is found at $0.2811, $0.28, the rising support trend line, and $0.2584. Further support is located at $0.25, $0.24, and $0.2345.
- The trading volume has increased from the average level of September.
- The RSI is in a bullish territory as they continue to control the market momentum. However, the Stocahstic RSI is in overbought territory as we wait for a potential bearish crossover signal to push the market lower in the short term.
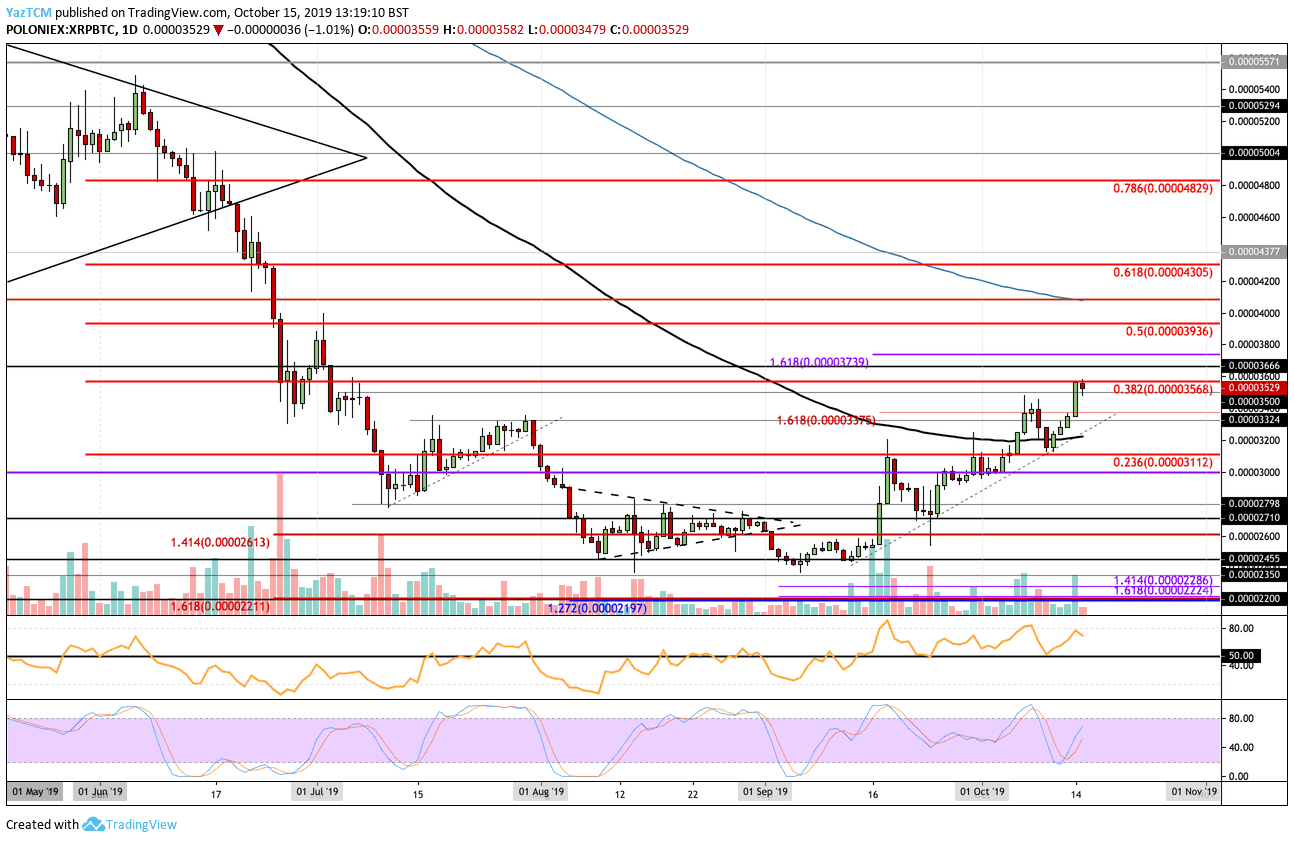
Looking at the XRP/BTC 1-Day Chart:
- Against Bitcoin, XRP managed to penetrate above the resistance at 3375 SATS. The coin continued higher, breaking above resistance at 3500 SAT to mee resistance at 3568 SAT (provided by the bearish .382 Fib Retracement).
- From above: If the bulls penetrate above 3568 SAT, higher resistance is expected at 3666 SAT, 3739 SAT, 3963 SAT (bearish .5 Fib Retracement), and 4000 SAT. Above 4000 SAT, resistance lies at 4100 SAT (200-days EMA) and 4305 SAT (bearish .618 Fib Retracement).
- From below: The nearest level of support lies at 3500 SAT. Beneath this, support lies at 3375 SAT, 3324 SAT, 3200 SAT (100-days EMA), and 3000 SAT.
- The trading volume is lower than the average we have seen during September.
- The RSI remains in the bullish favor as it hovers well above the 50 level. Furthermore, the Stochastic RSI has recently produced a bullish crossover signal which helped to push the market higher.
SPECIAL OFFER (Sponsored)
Binance Free $600 (CryptoPotato Exclusive): Use this link to register new account and receive $600 exclusive welcome offer on Binance (
full details).
LIMITED OFFER 2024 for CryptoPotato readers at Bybit: Use this link to register and open a $500 BTC-USDT position on Bybit Exchange for free!
Disclaimer: Information found on CryptoPotato is those of writers quoted. It does not represent the opinions of CryptoPotato on whether to buy, sell, or hold any investments. You are advised to conduct your own research before making any investment decisions. Use provided information at your own risk. See Disclaimer for more information.
Cryptocurrency charts by TradingView.