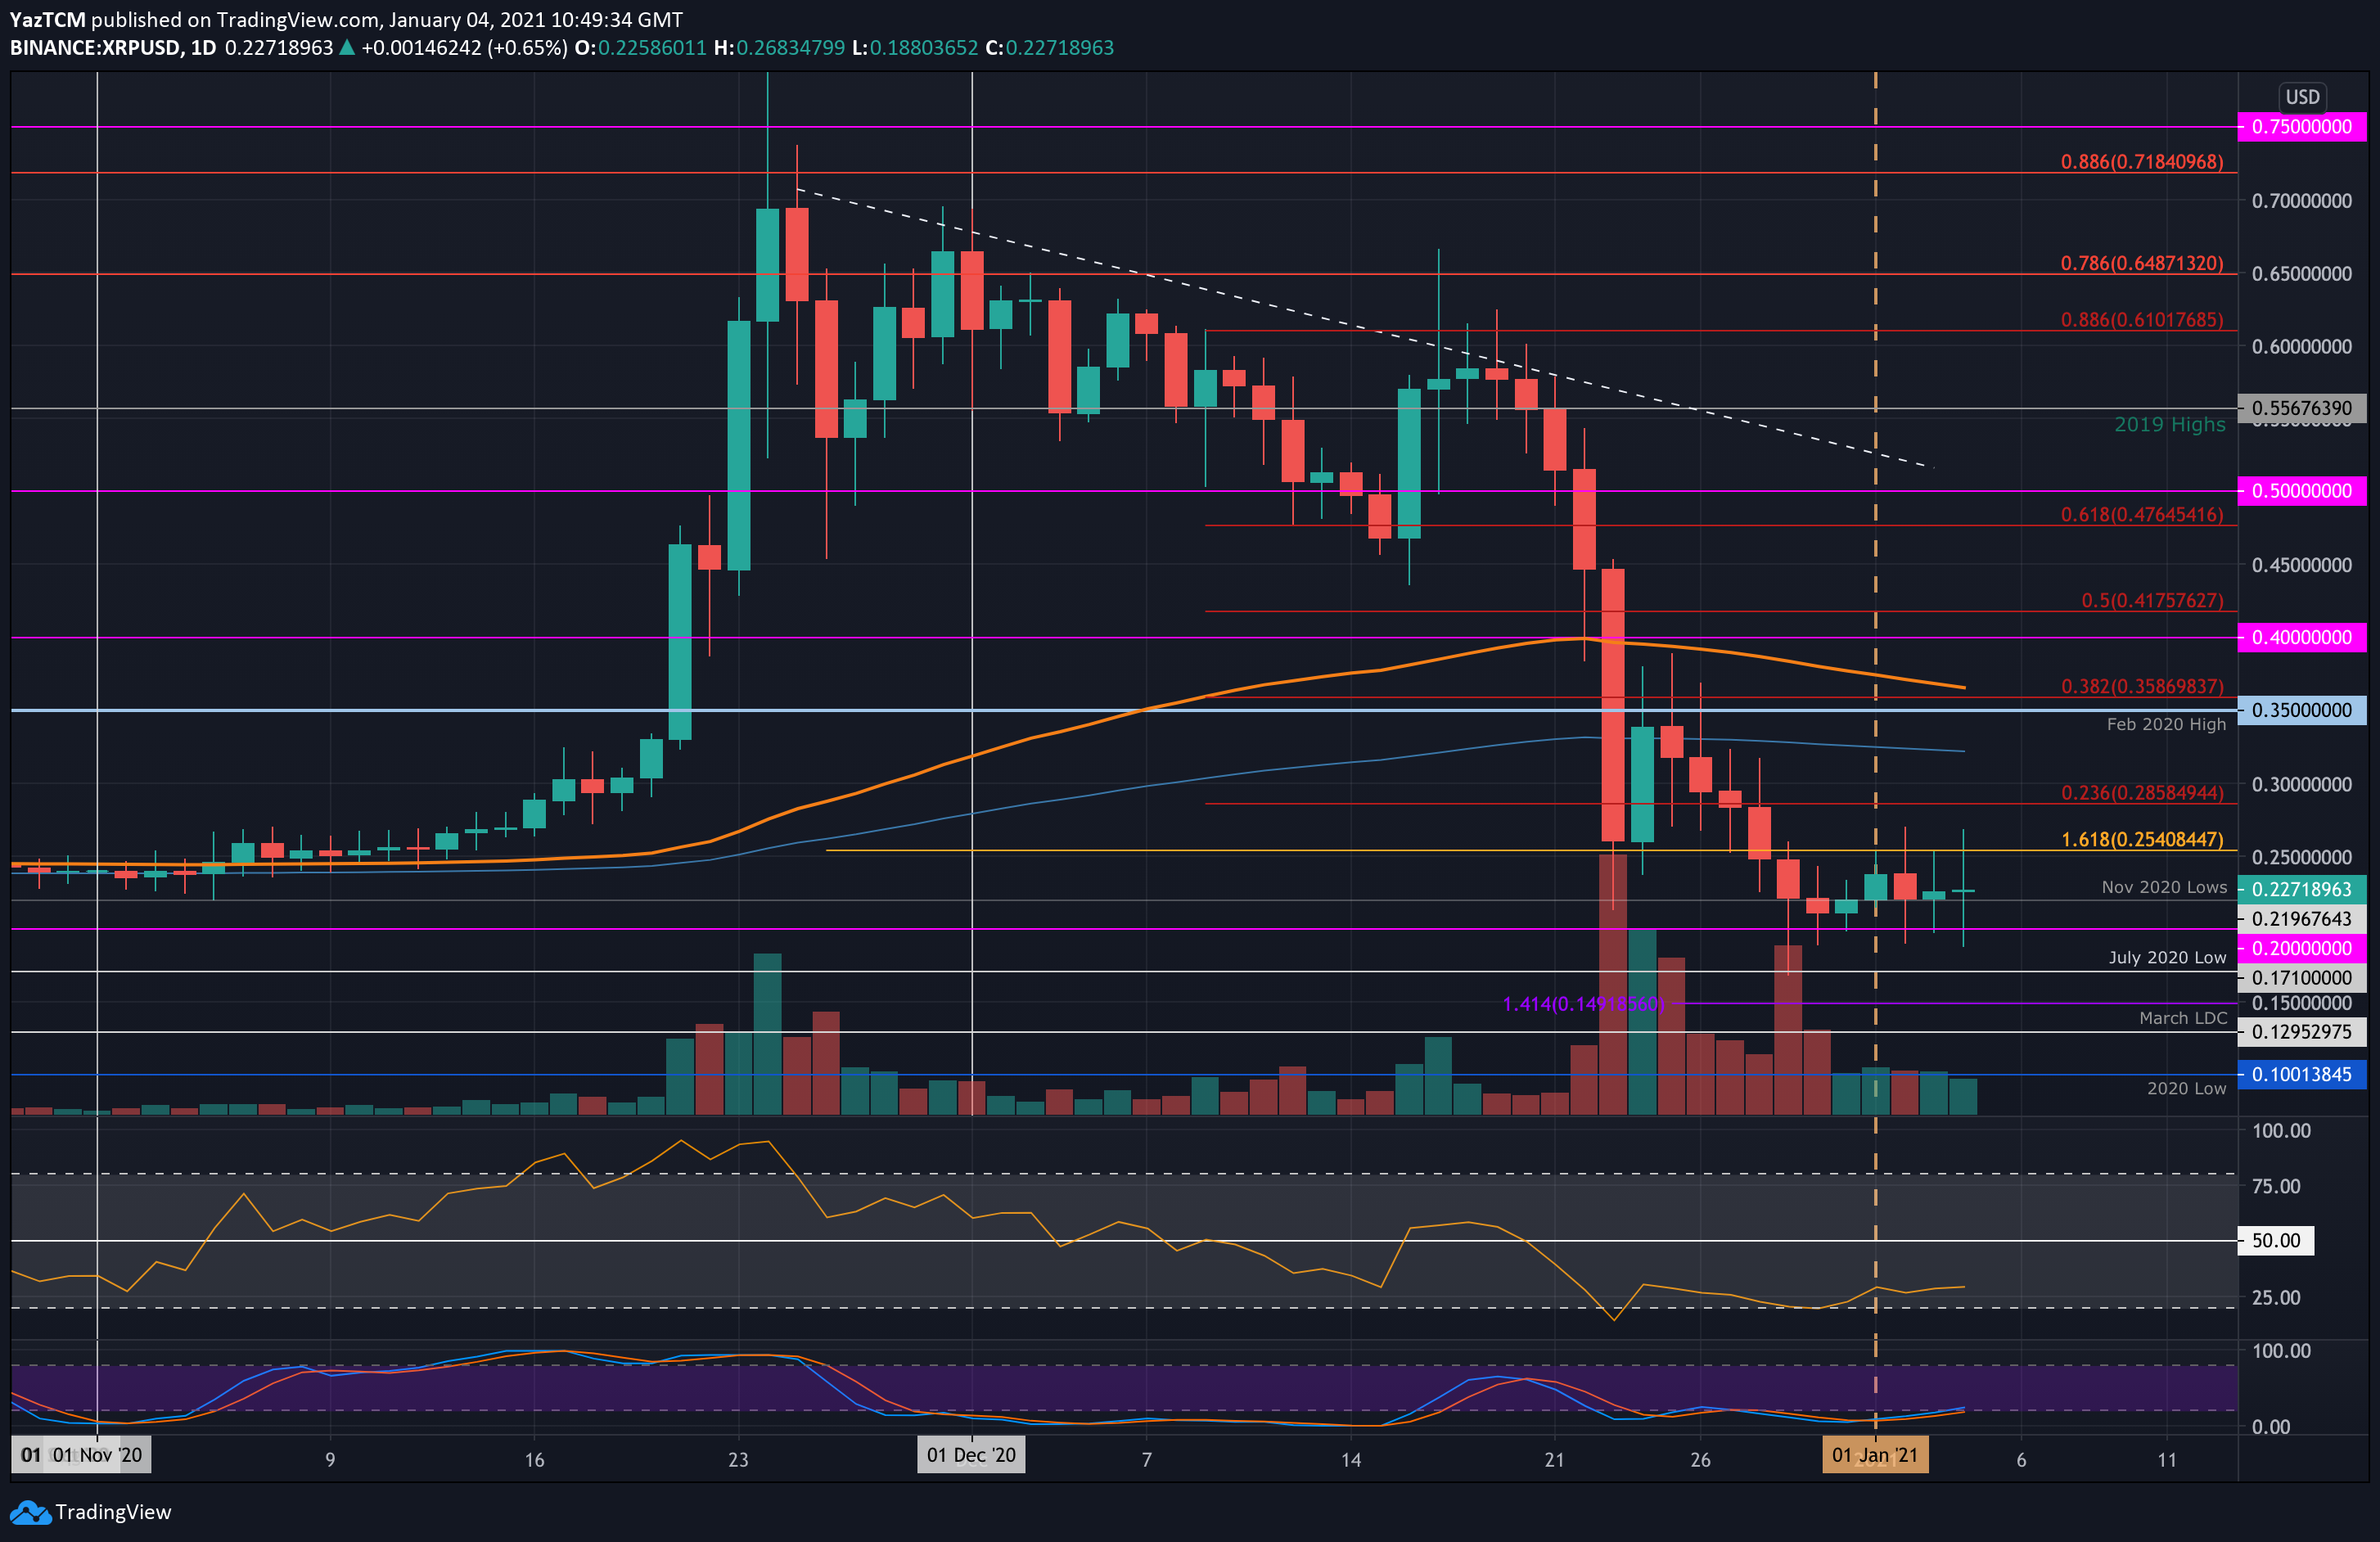
XRP/USD Daily Chart. Source: TradingView
Key Support Levels: $0.22, $0.2, $0.171.
Key Resistance Levels: $0.25, $0.285, $0.3..
After a disastrous end to 2020, in which XRP tanked by a severe 75%, following the SEC lawsuit, the coin attempts to establish a strong support base at $0.22 (November 2020 lows). So far, it has closed each daily candle above this level in January.
The cryptocurrency did spike beneath $0.2 on three occasions this month, but the bulls regrouped to bring XRP above $0.22 by the end of each day.
Looking ahead, if the buyers continue to drive higher, the first level of resistance lies at $0.25. This is followed by $0.285 (bearish .236 Fib), $0.3, and $0.325 (200-days EMA).
On the other side, the first level of support lies at $0.22 (November 2020 low). This is followed by $0.2, $0.171 (July 2020 low), and $0.15.
The RSI bounced from extremely oversold conditions at the end of December and is slowly starting to grind higher, suggesting the bearish momentum is easing up.
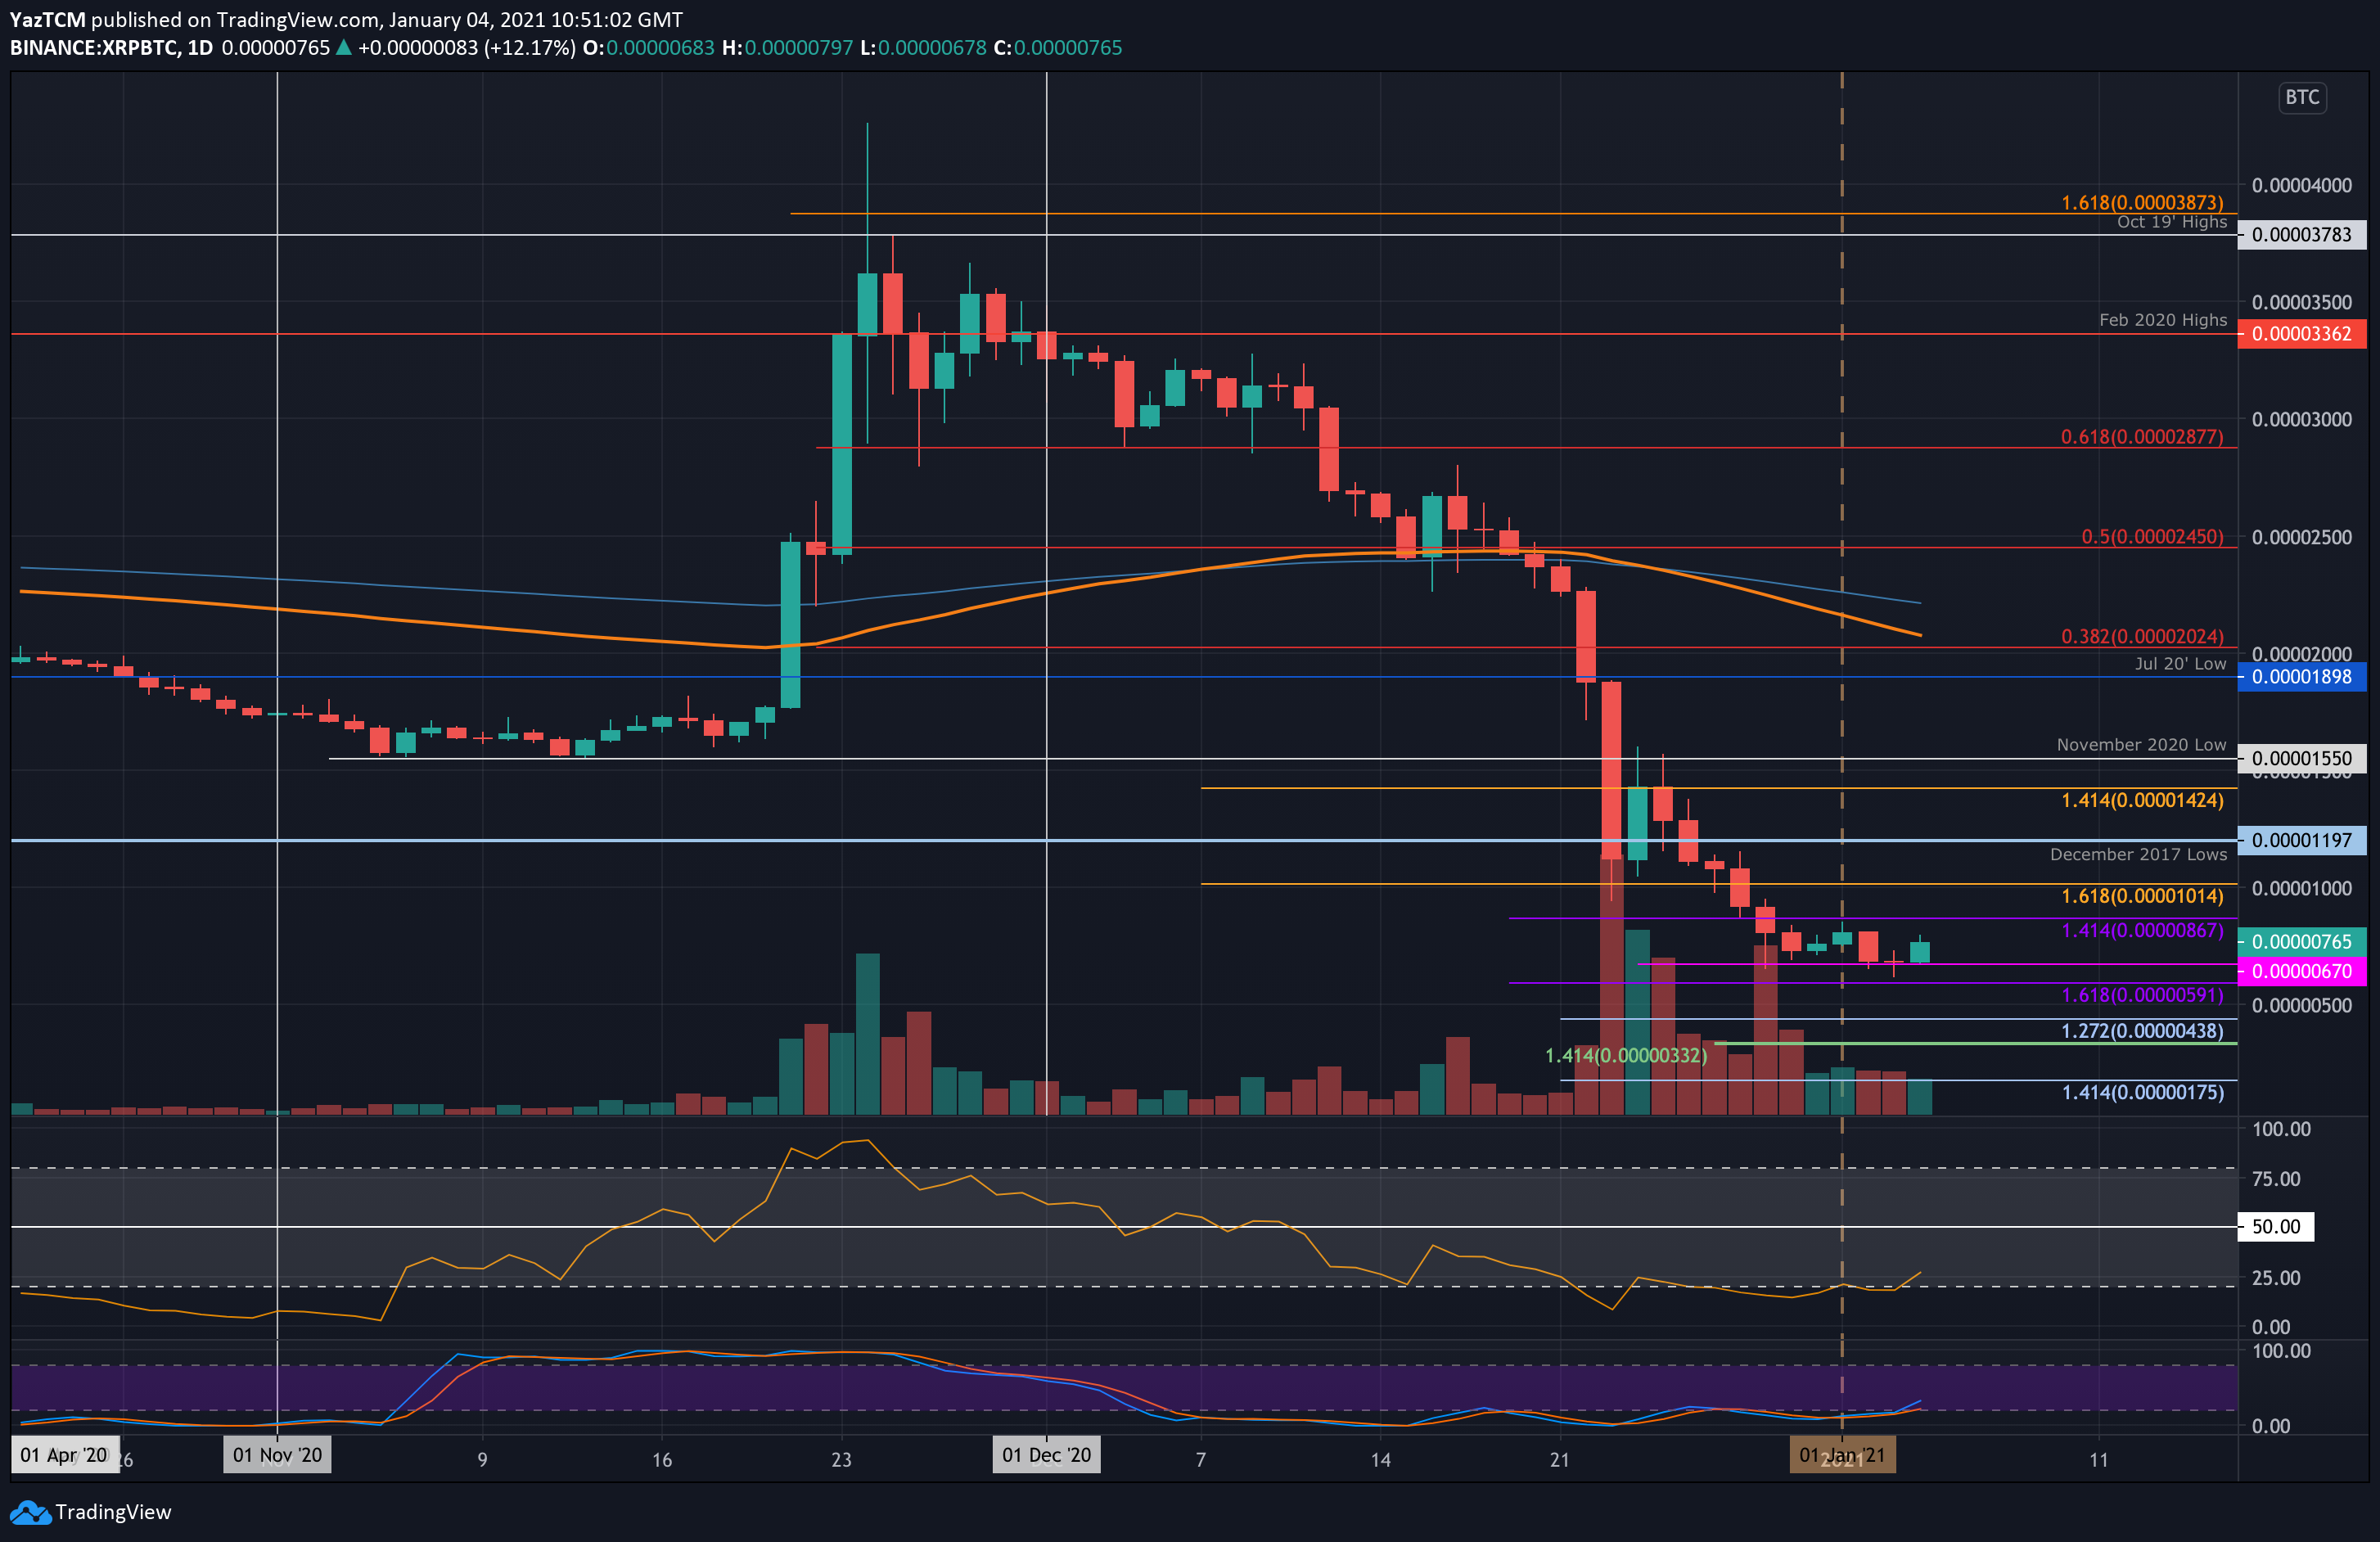
Key Support Levels: 670 SAT SAT, 590 SAT, 500 SAT.
Key Resistance Levels: 867 SAT, 1000 SAT, 1200 SAT.
Against Bitcoin, XRP dropped beneath the support at 1000 SAT toward the end of 2021 and continued to slide until 670 SAT in January. This is an 80% price plummet from the December 2020 highs.
Nevertheless, the coin managed to close above 670 SAT for each day in January so far, and the bulls pushed slightly higher today to trade at 765 SAT.
Moving forward, if the buyers push upward, the first level of strong resistance lies at 867 SAT. This is followed by 1000 SAT, 1200 SAT (December 2017 lows), and 1425 SAT.
Alternatively, the first level of support lies at 670 SAT. This is followed by 590 SAT (downside 1.618 Fib Extension), 500 SAT, and 438 SAT.
Likewise, the RSI here bounced from oversold conditions and is slowly grinding higher as the bearish momentum shows hints of fading away. Additionally, the Stochastic RSI is primed for a bullish crossover signal.