Ripple has seen a slight recovery from its 2019 recorded low, as the coin currently trades at a price of $0.318.
The market has traded sideways over the past 90 days after losing a small 2.7% over the that period. XRP had broken above the 100 days moving average line during the beginning of April 2019 to reach a high of $0.38 but has since then broken back down.
Ripple is ranked as the third largest cryptocurrency by market cap with a market cap of $12.83 billion.
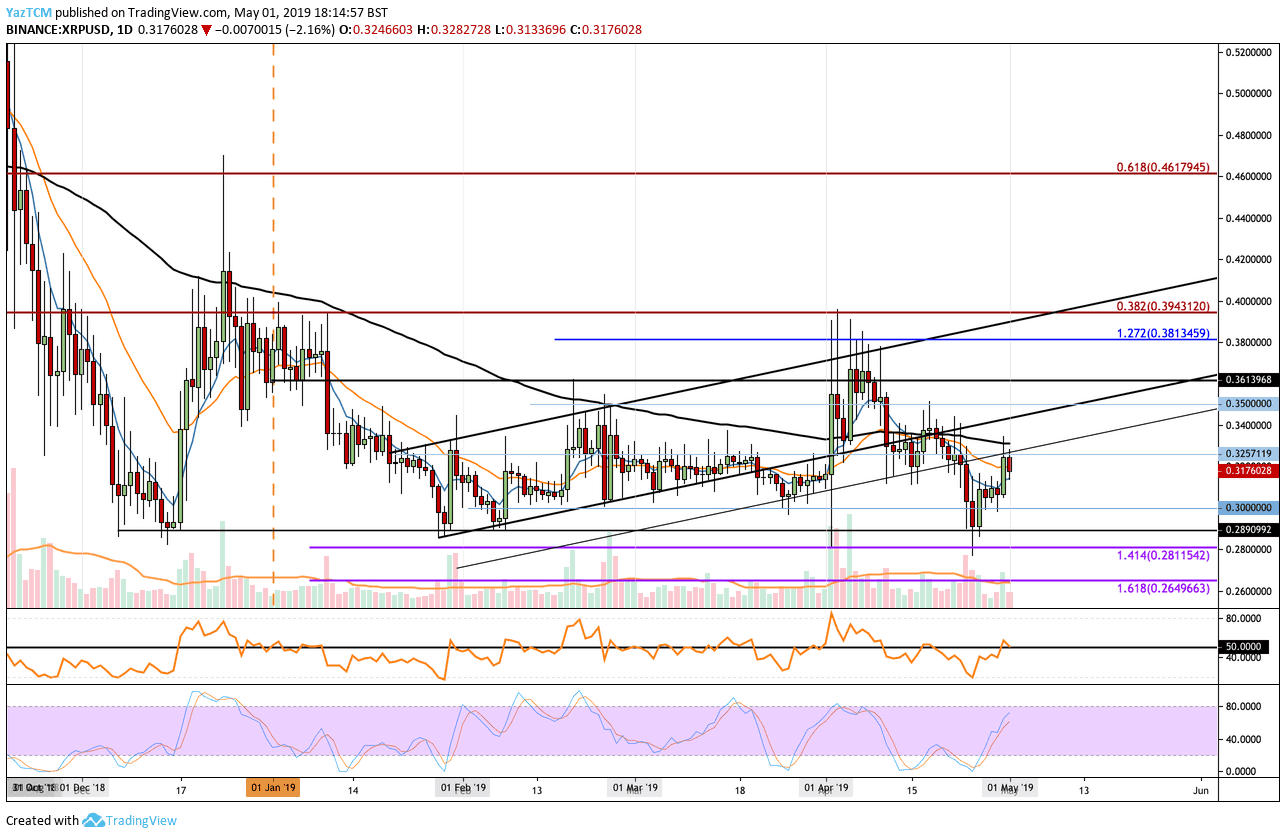
Looking at the XRP/USD 1-Day Chart:
- Since our previous Ripple analysis, we can see that the market had continued to break beneath the corresponding ascending trend-line. The market went on to fall into support at the $0.2890 level, which is also the December 2018 low. XRP had rebounded, but has met resistance around $0.3257.
- From above: The nearest level of resistance lies around $0.3325 which contains the 100-day moving average line. Above this, higher resistance lies at $0.34 and $0.35. Further resistance then lies at $0.3615 and $0.38.
- From below: The nearest level of support lies at $0.32. Beneath, further support lies at $0.30 and $0.289 which is the December 2018 and January 2019 low levels. Beneath $0.289, further support lies at $0.2811 and $0.2649.
- After the Stochastic RSI oscillator had marked a crossover above in the oversold area, the RSI has managed to break back above the 50 level which might be a promising sign for the bulls.
- The trading volume has remained below average over the past few days which could signal that the sellers have finished their selling.
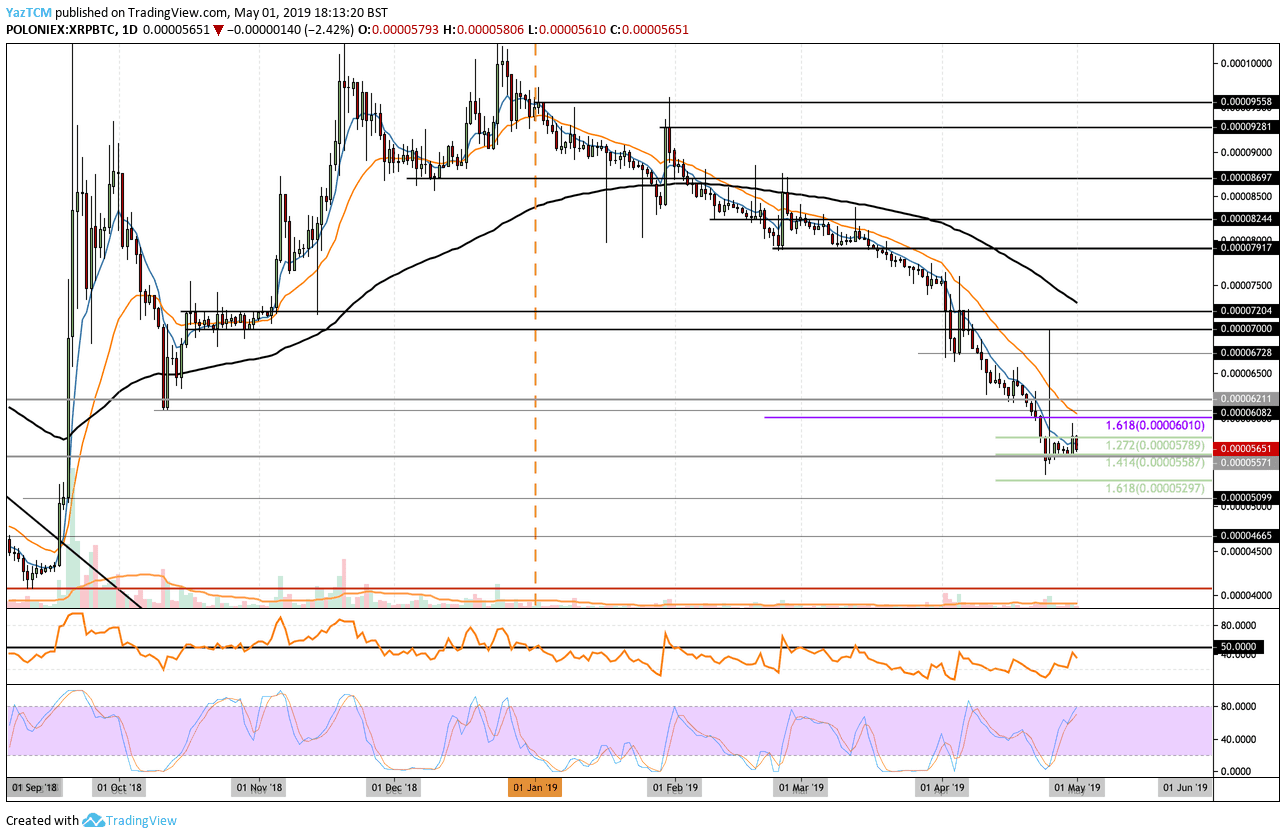
Looking at the XRP/BTC 1-Day Chart:
- Also against Bitcoin, Ripple continued to struggle and drop beneath the previous support at 6000 SAT. We can see that the market had managed to find support at 5590 SAT and has held there over the past few days.
- From above: The nearest level of resistance lies at 5790 SAT and then 6000 SAT. Further resistance lies at 6210 SAT, 6730 SAT and 7000 SAT. If the buyers can break above 7000 SAT, higher significant resistance lies at 7200 SAT which contains the 100 days moving average line.
- From below: As mentioned, the nearest level of support lies at 5590 SAT. Beneath this, further support lies at 5300 SAT and 5000 SAT.
SPECIAL OFFER (Sponsored)
LIMITED OFFER 2024 for CryptoPotato readers at Bybit: Use this link to register and open a $500 BTC-USDT position on Bybit Exchange for free!
Disclaimer: Information found on CryptoPotato is those of writers quoted. It does not represent the opinions of CryptoPotato on whether to buy, sell, or hold any investments. You are advised to conduct your own research before making any investment decisions. Use provided information at your own risk. See Disclaimer for more information.
Cryptocurrency charts by TradingView.