The hard-times continue for Ripple as the previous trading session has seen Ripple break beneath the $0.30 level. The cryptocurrency has lost a total of 6% over the past seven days bring the current trading price struggling with 30 cents level.
Despite the recent sell-off, the market is now trading at significant support levels. This combined with the fact that the RSI level is extremely in the oversold territories.
The veteran centralized project has now lost a total of 21% over the past 30 days. Ripple remains ranked in 3rd position as it holds a $12.5 billion market cap valuation.
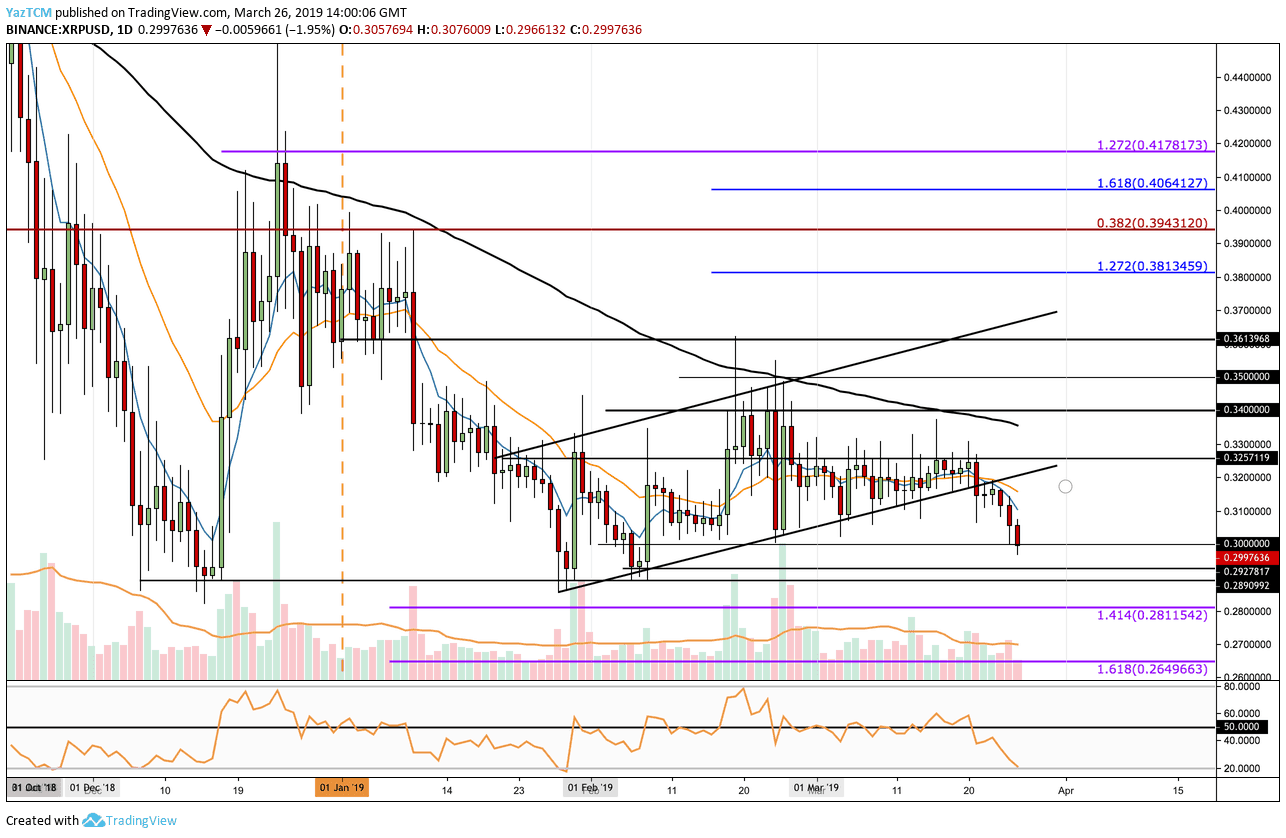
Looking at the XRP/USD 1-Day Chart:
- Since our last Ripple analysis, we can clearly see the market breaking below the ascending price channel. Price action had continued to drop beneath the $0.30 level. However, the market is currently battling to remain above this critical level of support at $0.30.
- From below: If the selling pressure continues, initial support below lies around the $0.29 area, along with the February 2019 low. If the market continues further lower, further support is located at $0.2811 where lies a downside 1.414 Fibonacci Extension level.
- From above: The nearest level of resistance now lies at $0.31. Above this, further resistance lies at $0.3257, $0.3355 (100-day moving average) and $0.34.
- The trading volume has remained at an average level.
- The RSI has recently dropped into extreme oversold conditions. This could be an indication that the sellers are overstretched which may allow a slight correction, which may assist XRP/USD to remain above $0.30 over the next few days.
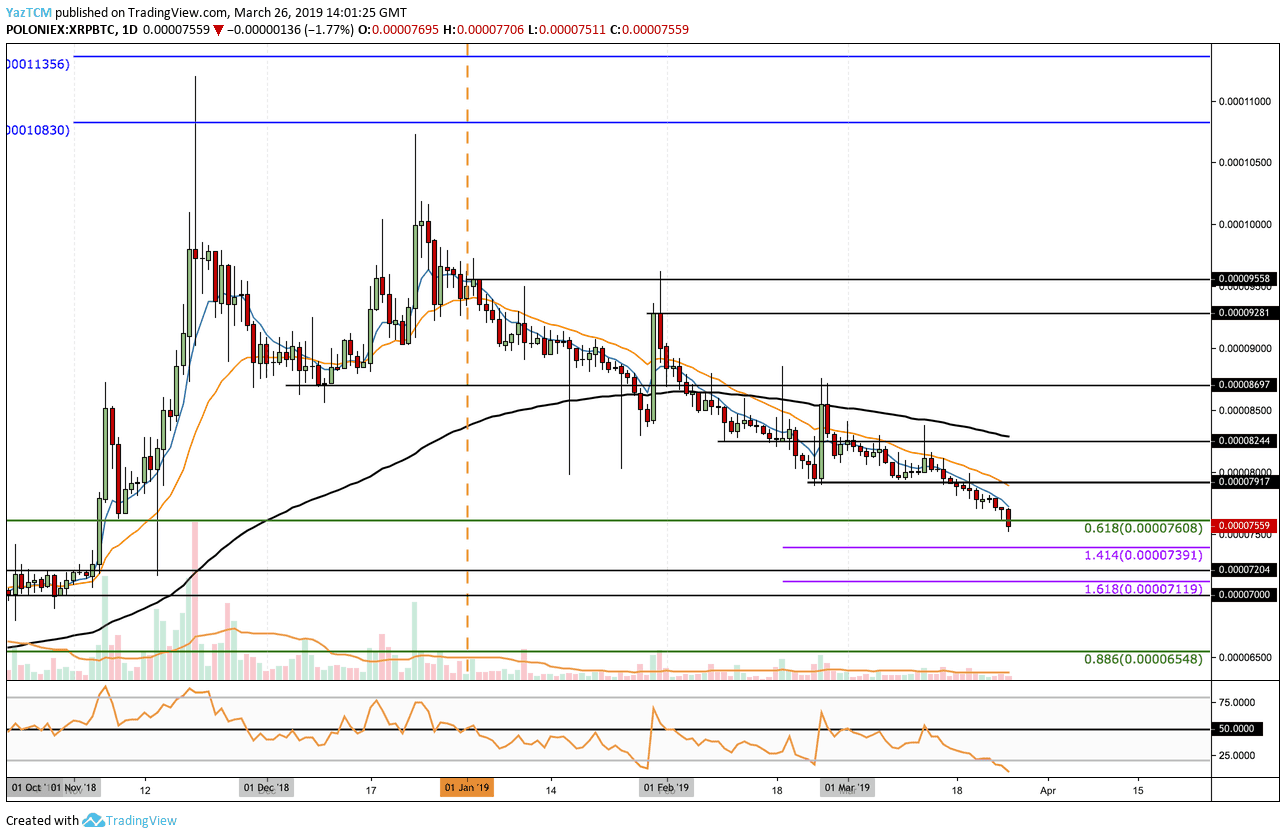
Looking at the XRP/BTC 1 Day Chart:
- Since our last XRP/BTC analysis, we can see that the coin has also dropped further lower. Price action has recently dipped beneath support at 7608 SAT where lies the short term .618 Fibonacci Retracement level.
- From below: The nearest level of support now lies at 7391 SAT which contains the downside 1.414 Fibonacci Extension level. Below, further support can be expected at 7204 SAT and 7119 SAT (downside 1.618 Fibonacci Extension level). If the selling continues below 7000 SAT, next support lies at 6550 SAT.
- From above: The nearest resistance now lies at 8000 SAT. Above this critical level, the market will encounter resistance at 8244 SAT, which also contains the 100-day moving average line, before the 8700 SAT.
- The RSI has reached more of an extremely oversold position concerning XRP/USD. The RSI does not tend to be this oversold for too long which may indicate that the bulls are ready to step back in.
SPECIAL OFFER (Sponsored)
Binance Free $600 (CryptoPotato Exclusive): Use this link to register new account and receive $600 exclusive welcome offer on Binance (
full details).
LIMITED OFFER 2024 for CryptoPotato readers at Bybit: Use this link to register and open a $500 BTC-USDT position on Bybit Exchange for free!
Disclaimer: Information found on CryptoPotato is those of writers quoted. It does not represent the opinions of CryptoPotato on whether to buy, sell, or hold any investments. You are advised to conduct your own research before making any investment decisions. Use provided information at your own risk. See Disclaimer for more information.
Cryptocurrency charts by TradingView.