Ripple’s stagnation continues as the market remains in a sideways action. Ripple is currently struggling to break above the $0.33 level but if it does succeed, we could see it quickly heading toward $0.35 and beyond.
Ripple has recently announced a partnership with the blockchain gaming company Forte. The two companies have come together to create a $100 million fund for game development. Forte will manage the fund and target game economies with more than 50,000 daily users.
This partnership should help give rise to in-game cryptocurrency economies that can leverage the use of blockchain technology to conduct in-game micropayments.
Ripple remains ranked in 3rd position of the leading cryptos as it presently holds a $13 billion market cap value.
Looking at the XRP/USD 1-Day Chart:
- Since our last Ripple analysis, the coin has continued to trade in a sideways action, unable to break above $0.33, as the market players remain on the sidelines, anticipating the next big move. The cryptocurrency has continued to trade along the lower boundary of an ascending price channel. The coin has also been trading underneath a short term descending trend line (dashed line) for the entirety of March 2019. This trend line has formed a short term symmetrical triangle pattern. XRP/USD is quickly approaching the apex of the triangle where a breakout is expected.
- From above: The nearest level of resistance lies at $0.3257 and $0.33. If buyers can break above, further resistance lies at $0.34. The resistance at $0.34 is further bolstered by the 100-day moving average line. Resistance above $0.34 lies at $0.35 and then the upper boundary of the ascending price channel.
- From below: The nearest level of support lies at the lower boundary of the ascending price channel. Support beneath this can then be expected at $0.31 and $0.30. If the sellers break beneath $0.30 we can expect support at $0.2927 and $0.2858.
- The RSI continues to trade directly along the 50 level which indicates indecision within the market.
- The trading volume has started to rise over the past 3 days.
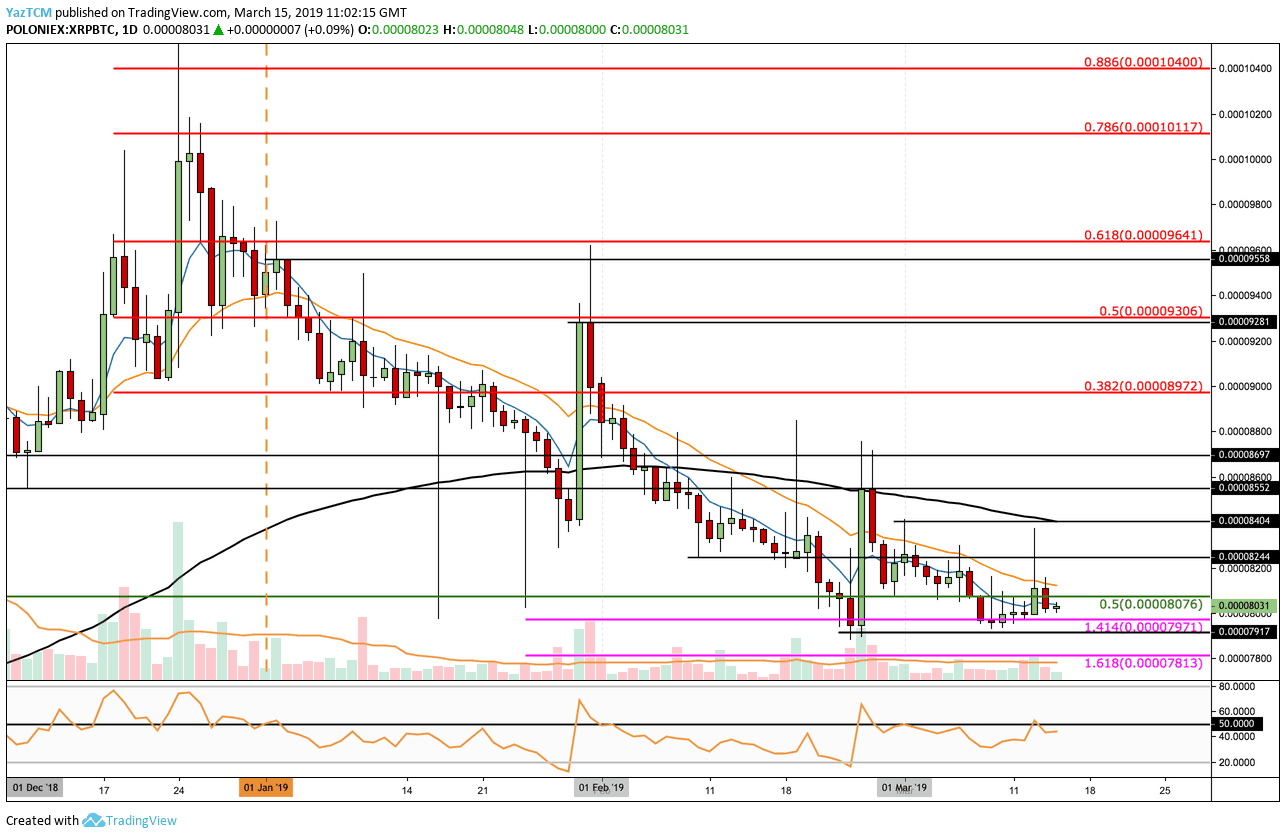
Looking at the XRP/BTC 1 Day Chart:
- XRP/BTC had managed to break above the resistance at 8076 SAT and rise close to 8400 SATS, however, the coin has dropped and since returned to trade back at around 8031 SATS.
- From above: The nearest resistance lies at 8076 SAT, 8244 SAT and 8522 SAT. Further resistance above 8600 SAT lies at 8700 SAT and 9000 SAT, where lies the bearish .382 Fibonacci Retracement level.
- From below: The nearest level of support lies at 8000 SAT and then at 7971 SAT and 7917 SAT. Further support below 7900 SAT can be found at 7813 SAT where lies the downside 1.618 Fibonacci Extension level.
- The RSI remains beneath 50 as the sellers remain marginally in control of the momentum. To see Ripple rise we would need to see the RSI break above 50 and travel higher.
SPECIAL OFFER (Sponsored)
LIMITED OFFER 2024 for CryptoPotato readers at Bybit: Use this link to register and open a $500 BTC-USDT position on Bybit Exchange for free!
Disclaimer: Information found on CryptoPotato is those of writers quoted. It does not represent the opinions of CryptoPotato on whether to buy, sell, or hold any investments. You are advised to conduct your own research before making any investment decisions. Use provided information at your own risk. See Disclaimer for more information.
Cryptocurrency charts by TradingView.