Ripple (XRP) has seen a small price increase of around 1.12% over the past 24 hours, allowing the price to break back above the $0.40 level. However, the coin has now reached the resistance at the upper boundary of a symmetrical triangle pattern and looks like it may struggle to get above.
It remains ranked in 3rd place amongst the top cryptocurrencies as it currently holds a $17.06 billion market cap. XRP has now seen a promising bullish increase of 25% over the past 30 days which suggests we may see more bullish action on the horizon.
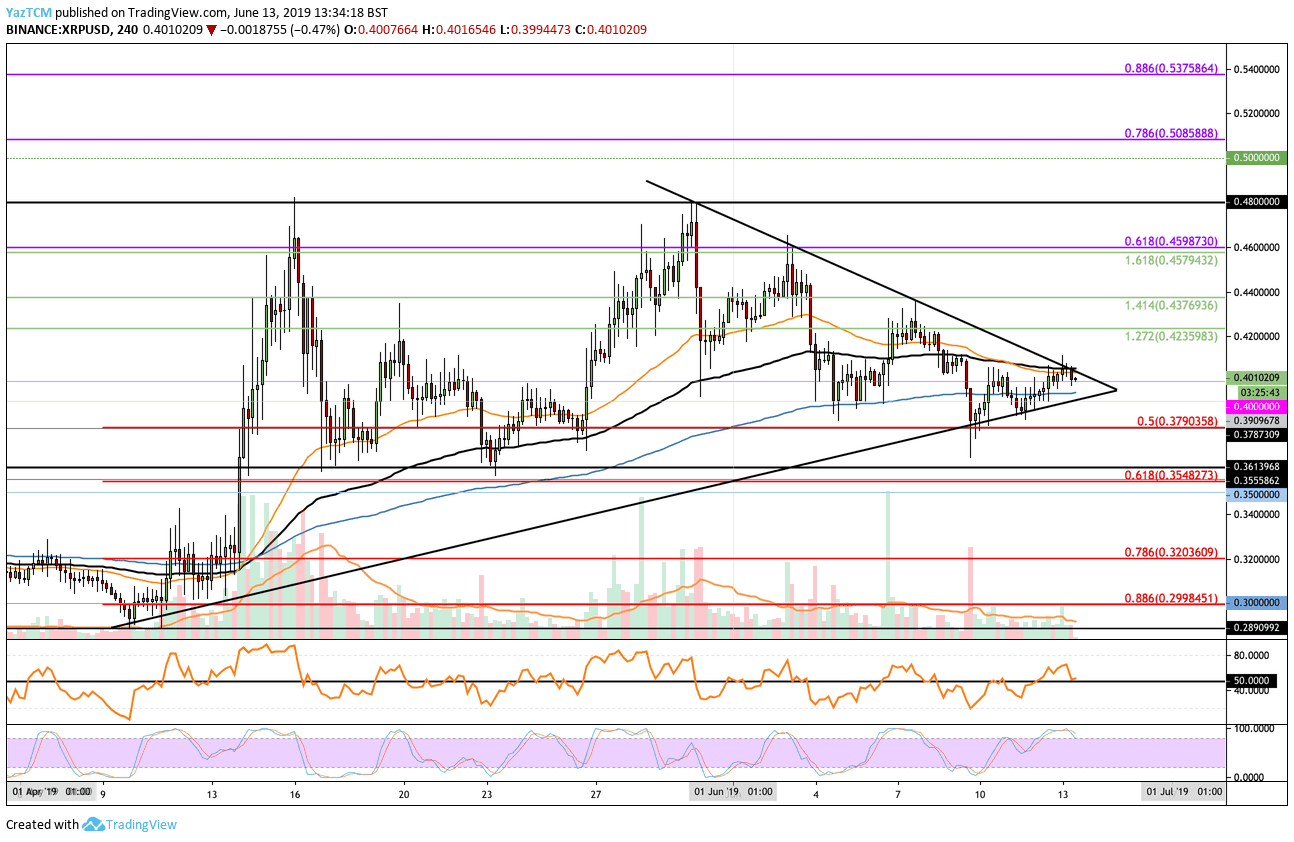
Looking at the XRP/USD 4-HR Chart:
- Since our last XRP/USD analysis, we can see that XRP has rebounded from our previously highlighted support at $0.3790 and has continued higher above $0.40. However, XRP/USD is now trading at the upper boundary of a consolidation pattern.
- From above: If the bulls can push the market above the upper boundary, we can expect immediate higher resistance above to be located at $0.42 and $0.4380. Above this, further resistance is then located at $0.46 – the June 2019 high. If the bulls continue above $0.46, resistance lies at $0.48 and $0.50.
- From below: The nearest level of support now lies at $0.3906. Beneath this, further support lies at the lower boundary of the triangle. If the sellers break beneath, support is then located at $0.3790, $0.3610 and $0.35.
- The trading volume remains pretty lackluster and below the average.
- The Stochastic RSI is in overbought conditions on the 4HR chart which suggests that XRP may break beneath the triangle.
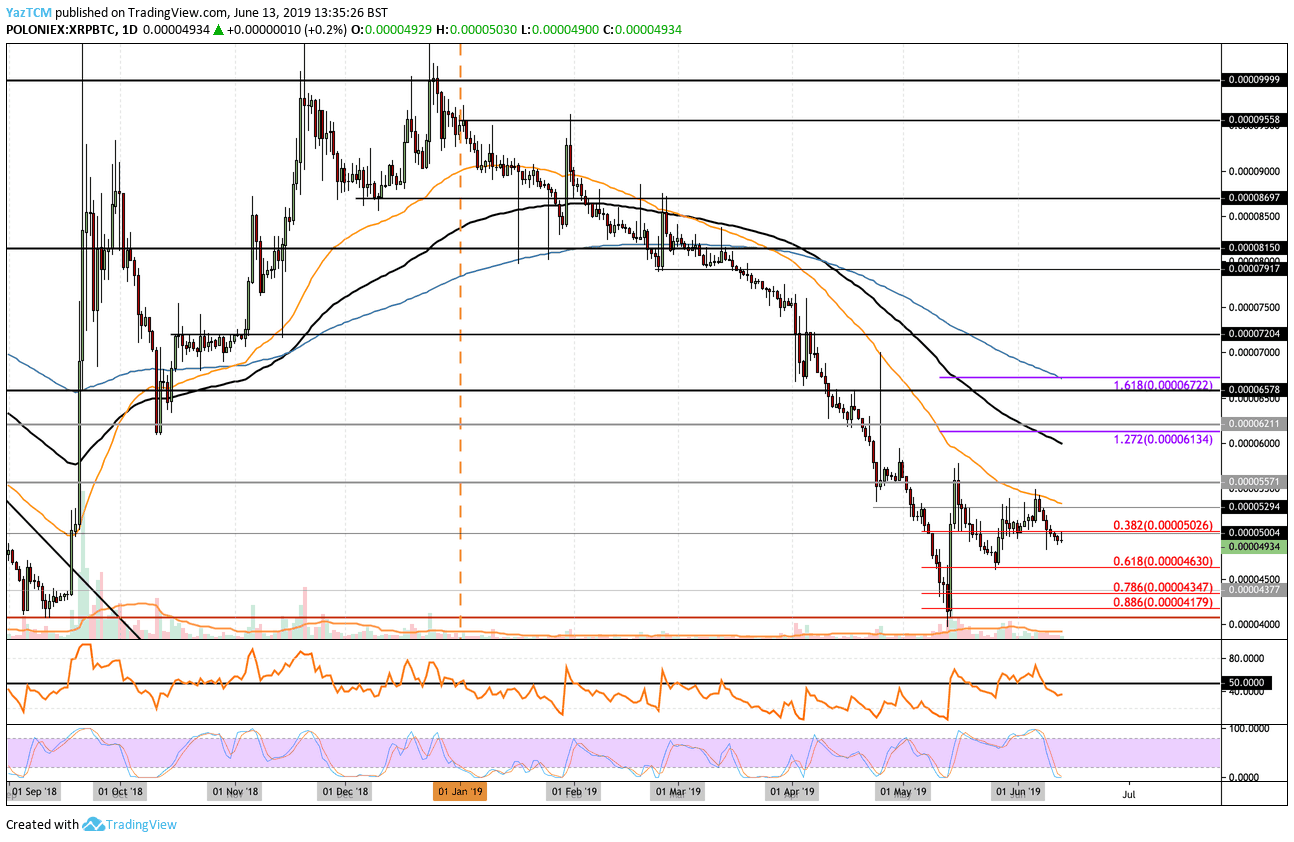
Looking at the XRP/BTC 1-Day Chart:
- Against Bitcoin, We can see that XRP has been struggling to hold grounds above 5000 SAT as it currently trades at around 4934 SAT.
- From above: The nearest level of resistance lies at 5000 SAT. Above this, higher resistance is located at 5300 SAT, 5580 SAT and 6000 SAT. If the buyers push XRP/BTC above 6000 SAT, higher resistance is located at 6135 SAT, 6200 SAT, and 6500 SAT.
- From below: The nearest level of support now lies at 4900 SAT. Beneath this, we can expect lower support at 4630 SAT, 4500 SAT, and 4350 SAT.
- The trading volume in XRP/BTC remains about average.
- The Stochastic RSI has recently dropped to extreme oversold conditions on the daily chart which suggests that a bullish rebound above 5000 SAT is imminent.
SPECIAL OFFER (Sponsored)
LIMITED OFFER 2024 for CryptoPotato readers at Bybit: Use this link to register and open a $500 BTC-USDT position on Bybit Exchange for free!
Disclaimer: Information found on CryptoPotato is those of writers quoted. It does not represent the opinions of CryptoPotato on whether to buy, sell, or hold any investments. You are advised to conduct your own research before making any investment decisions. Use provided information at your own risk. See Disclaimer for more information.
Cryptocurrency charts by TradingView.