The Crypto market’s volume is decreasing as BTC chart is getting closer and closer to the edge of the descending trend-line that has been formed in the past month (since December 28).
This technical formation and volume decline, together with the uncertainty of the fundamentals, result in a situation the bears and the bulls are waiting for the next market’s trigger to point on the next move.
XRP is currently trading at the $0.314 price area, which is not too far from where it was traded during our previous price analysis.
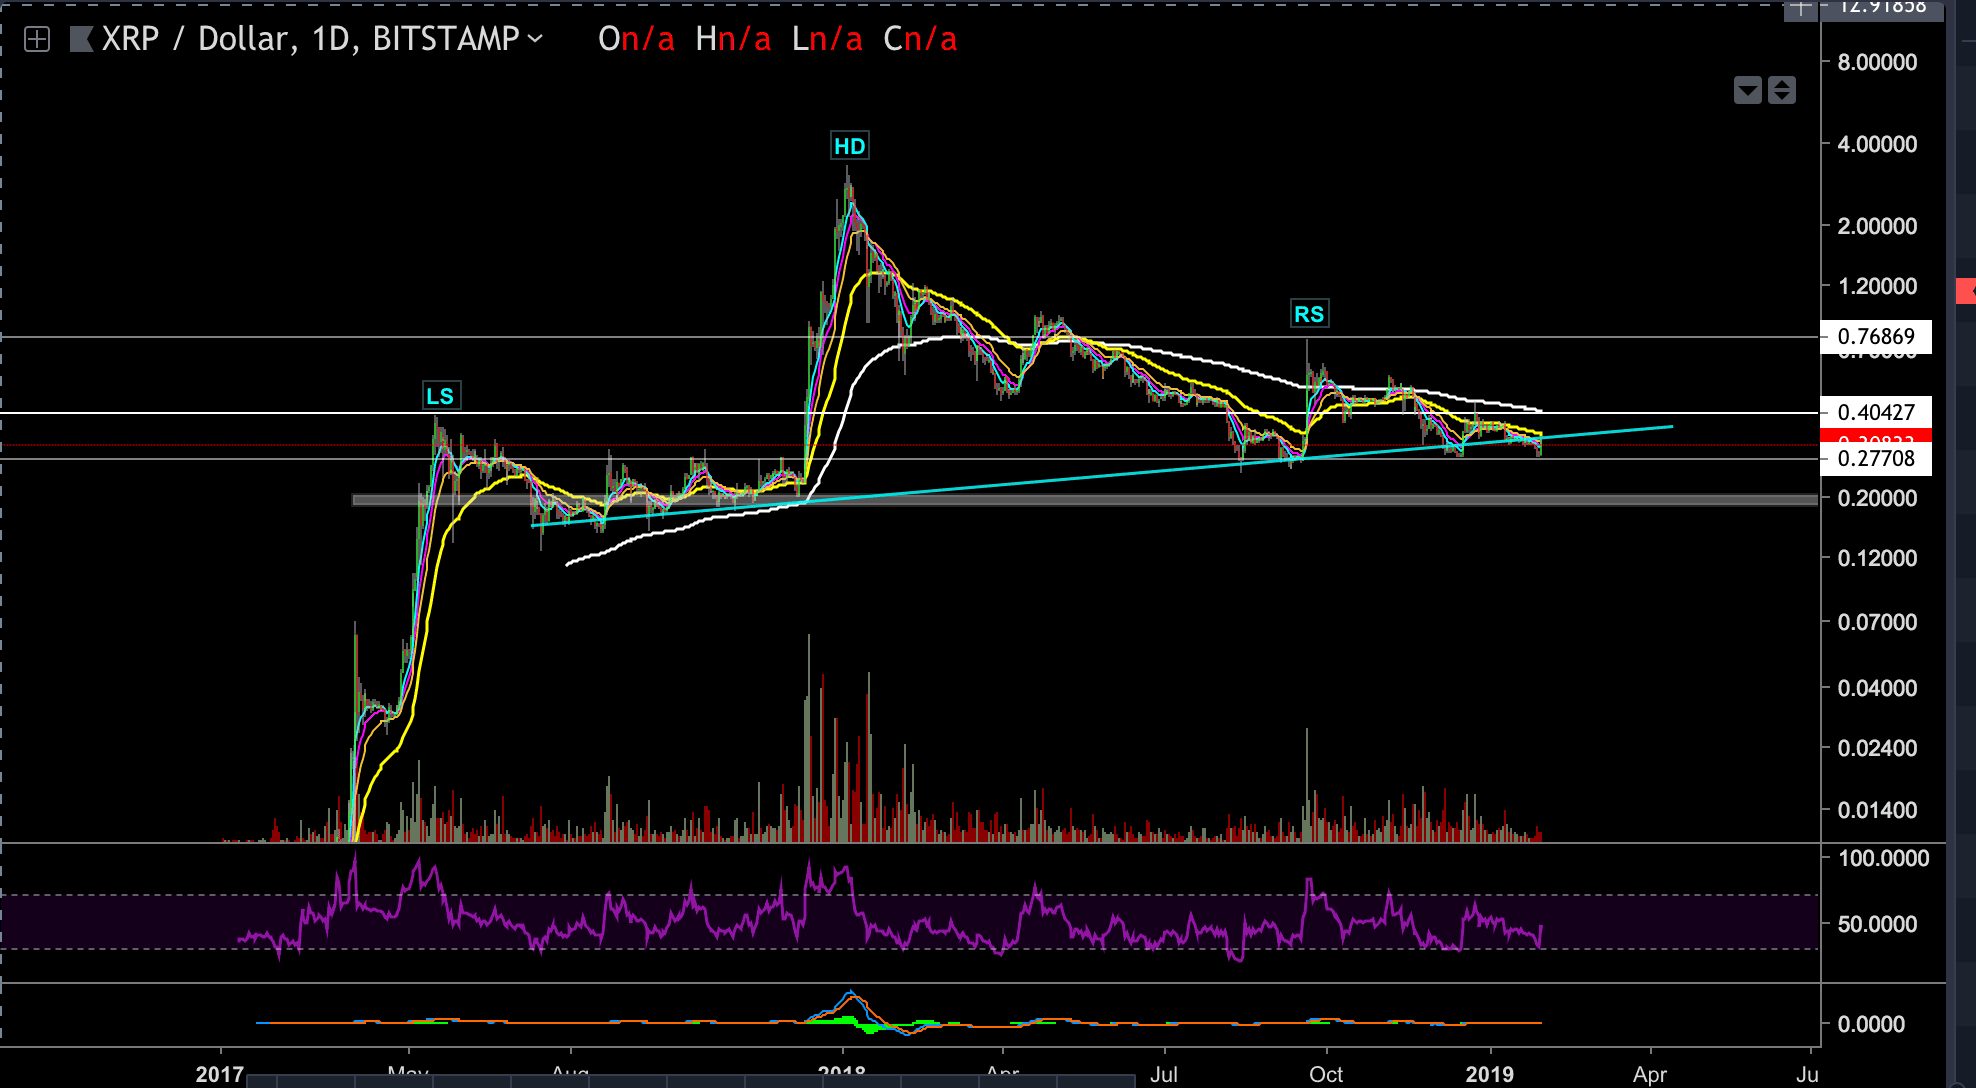
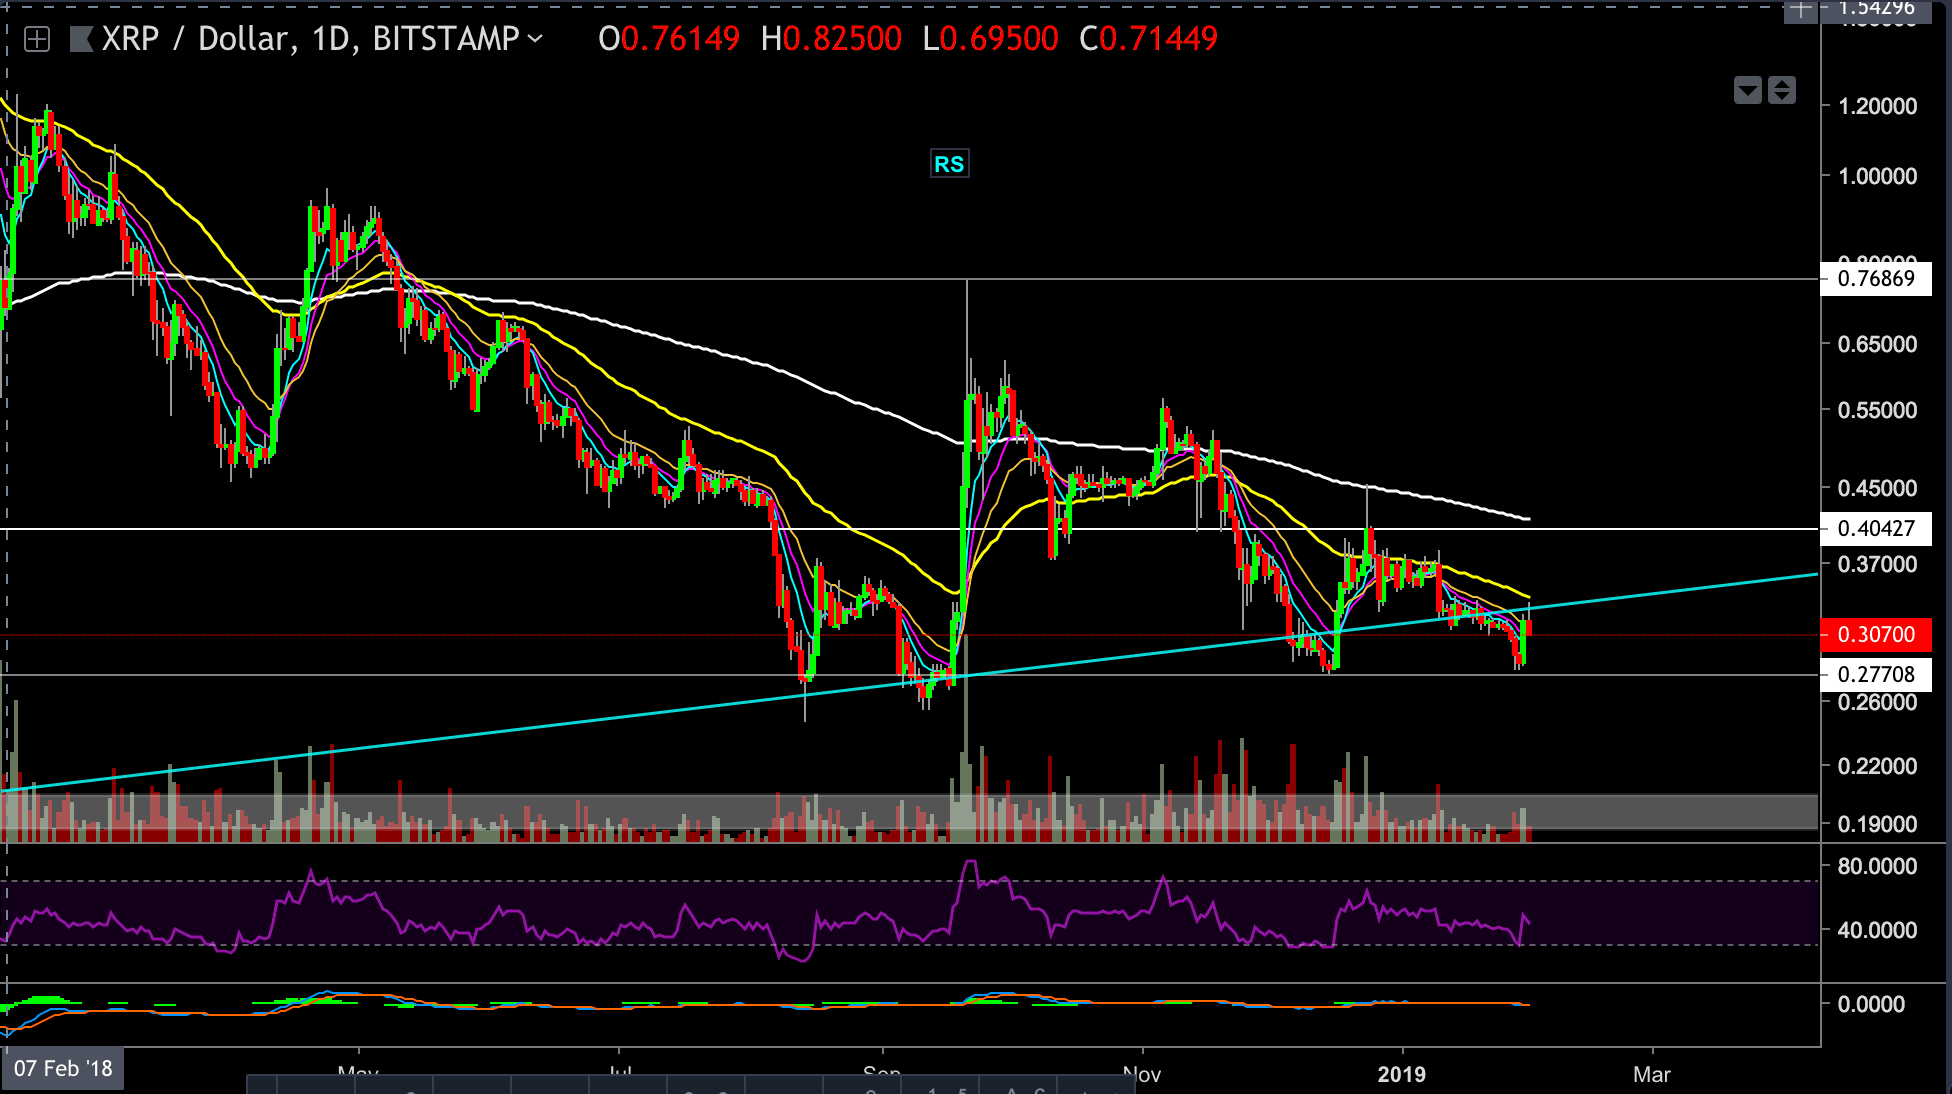
Looking at the XRP-USD 1-Day chart:
- XRP is retesting the supporting trend-line that has been holding up the price since July 2017, a crucial ascending trend-line.
- A decisive break below the above line will probably trigger a bearish scenario, which could lead XRP price ~13% down, towards the $0.277 support level. The last level was mentioned in our previous In case the $0.277 area doesn’t hold, XRP could tumble lower toward the $0.2 support zone which is a 35% decline from current prices (daily chart).
- We could also notice a massive Head and Shoulders formation that has been developing since 2017, despite that it’s not the prettiest H&S formation, this formation has a potential to trigger a devastating move with long-term targets around $0.07.
- On the more bullish scenario, if the daily trend line support level holds the current price level, following buyers strength, then XRP could end-up retesting the $0.4 resistance level, which we have mentioned many times here. This level would be the highest price level of XRP since the rally of May 2017.
- The daily chart 200 EMA is also awaiting as a resistance level, around $4.
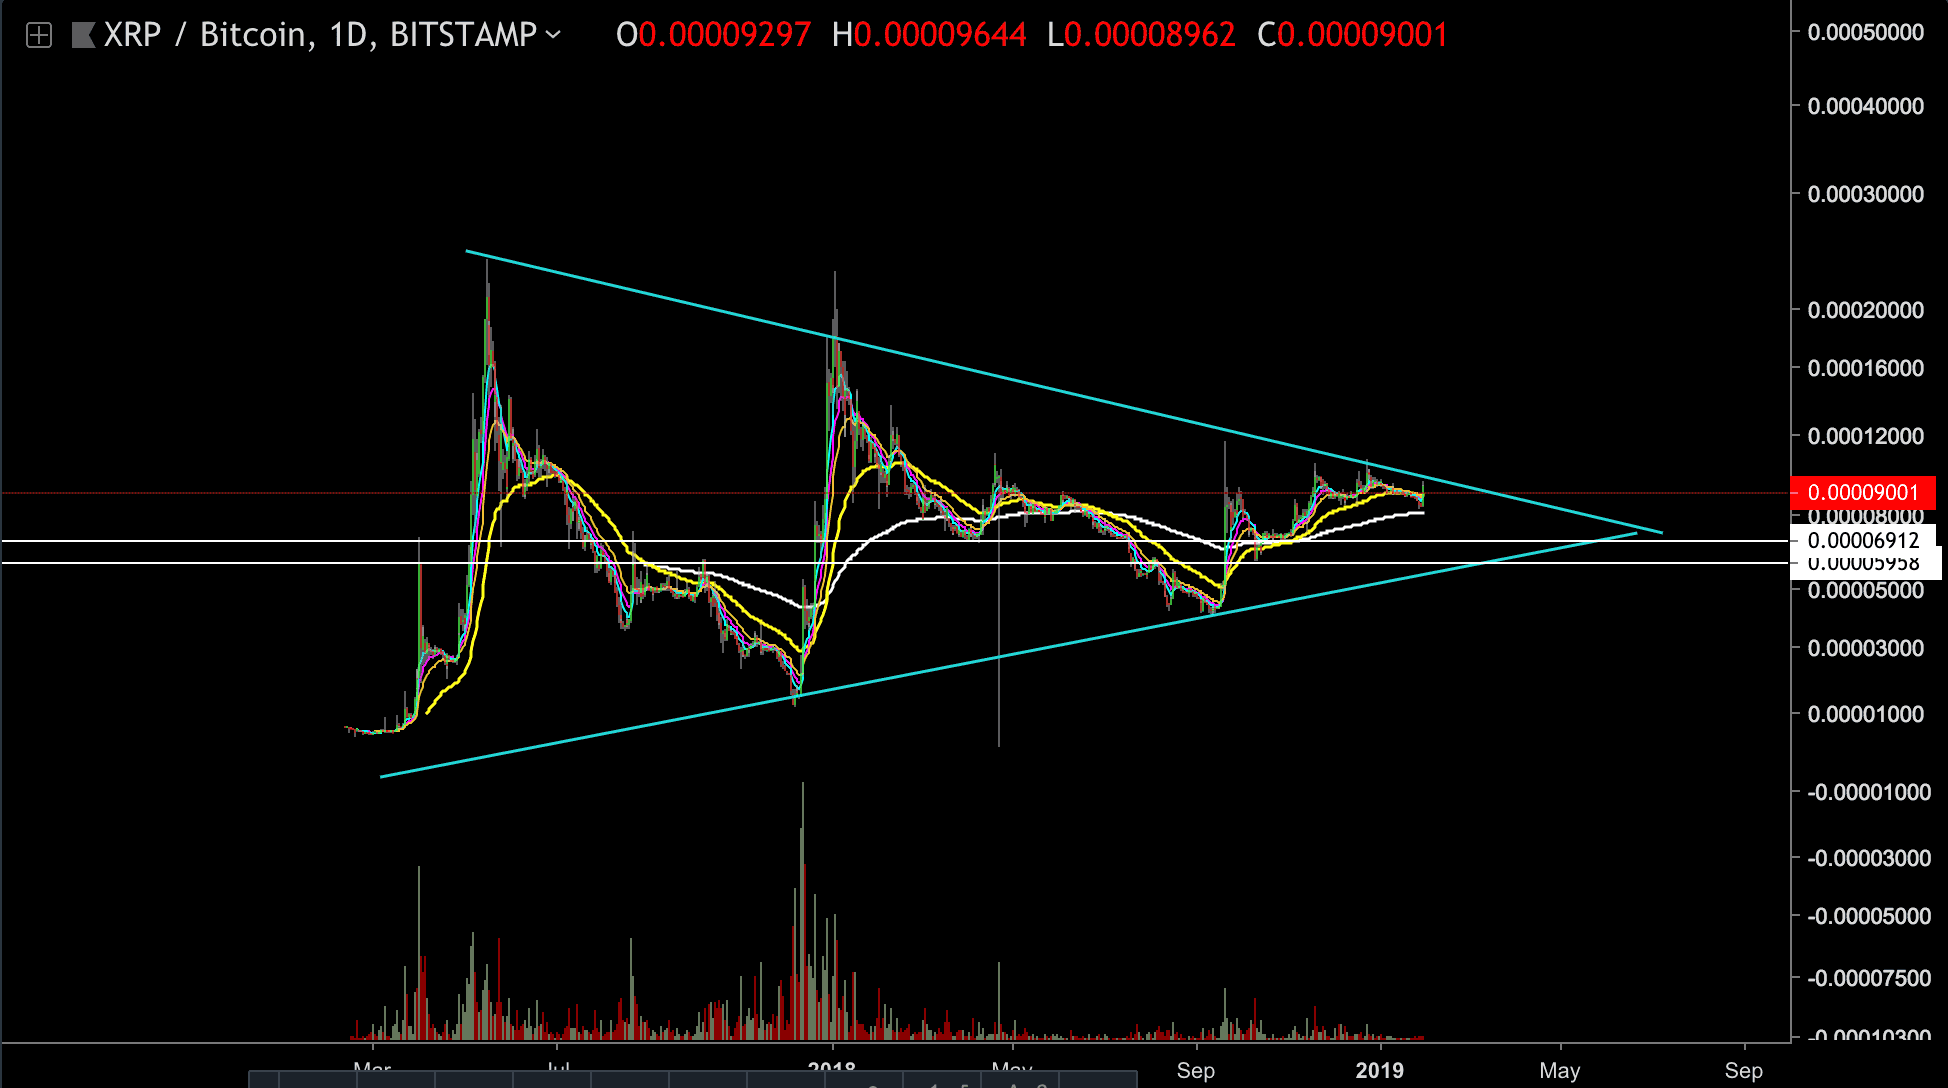
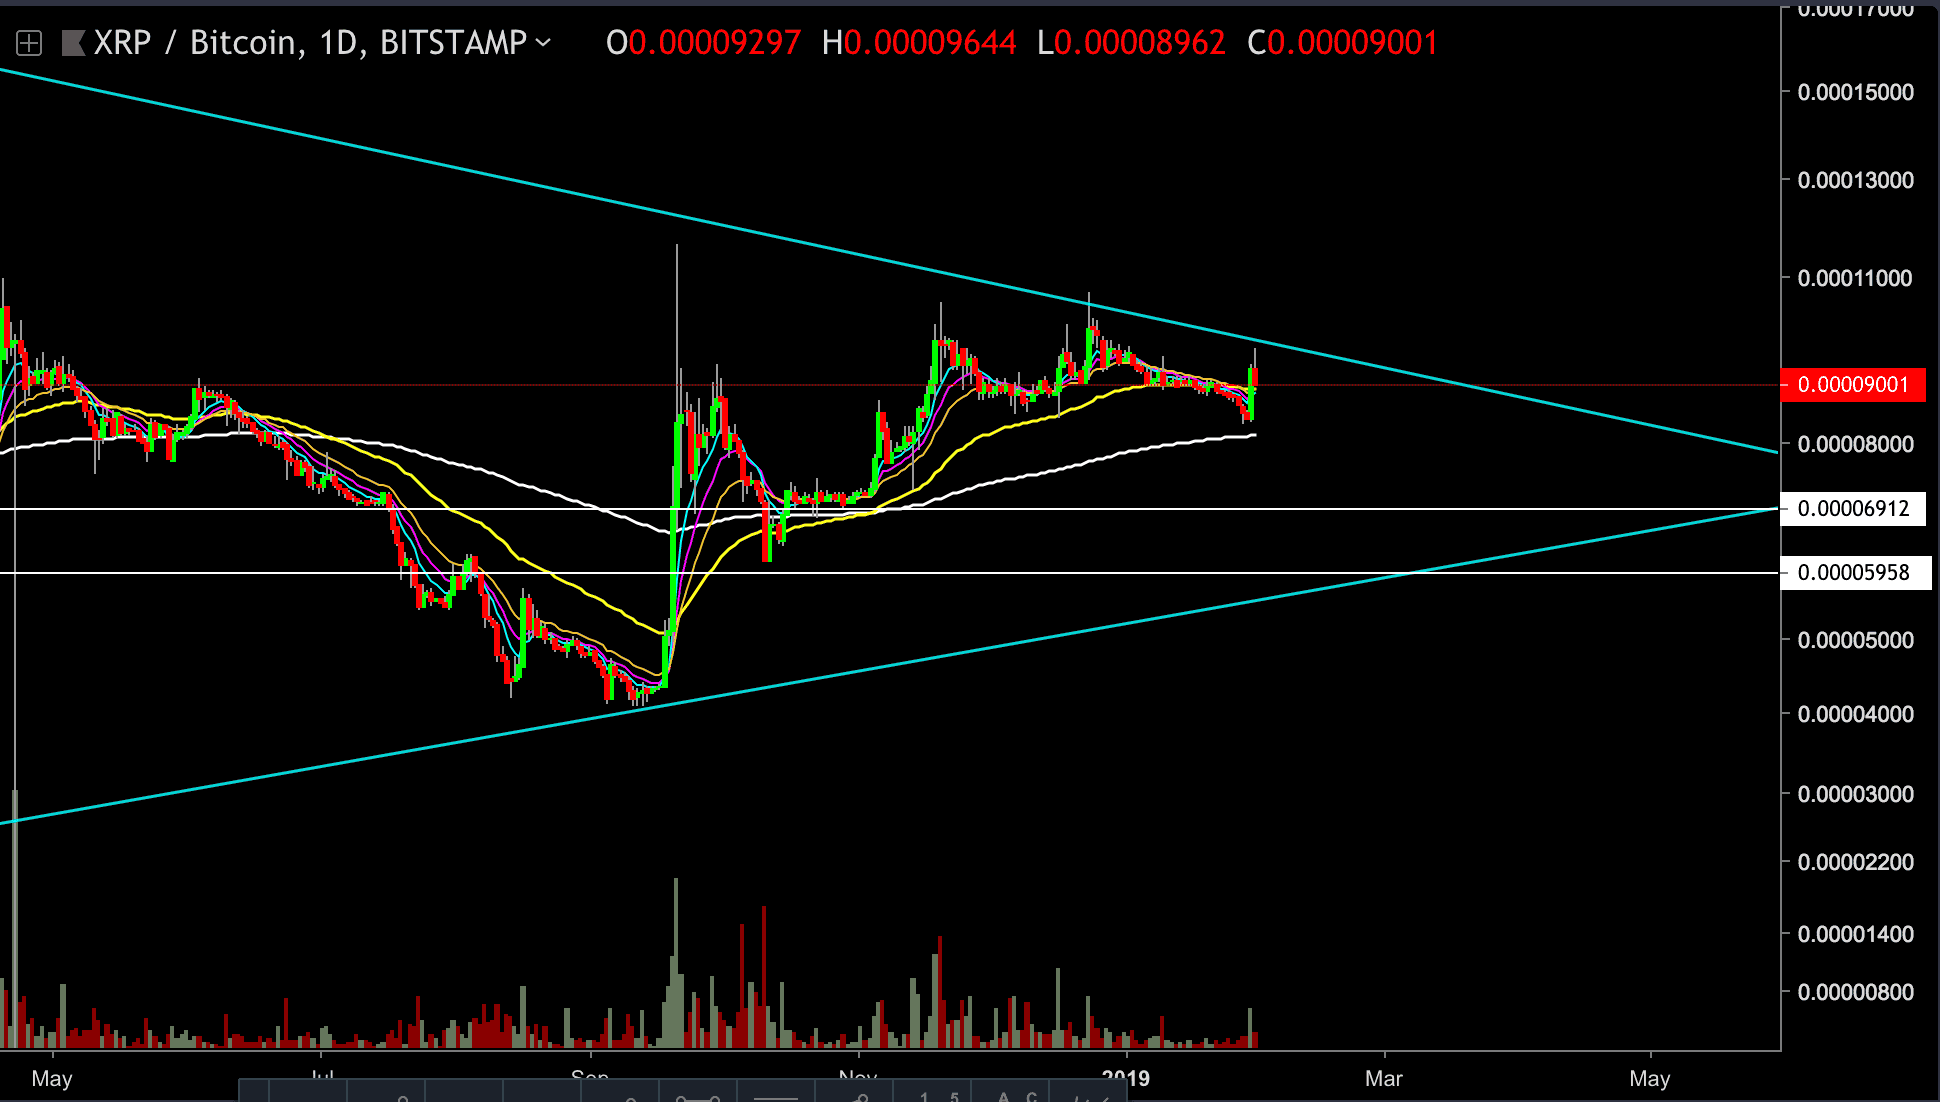
Looking at the XRP-BTC 1- Day chart:
- XRP had approached the top trend-line resistance level of the large triangle formation (marked on the daily chart) and got rejected.
- On the bearish side, XRP could decline toward the 0.00007 BTC support level. From there, might have a bearish continuation of the triangle support trend line.
- On the bullish side, XRP will have to show extra strength to move above the resistance level of the triangle formation: At the moment, the optimistic side could be a retest of this resistance level.
SPECIAL OFFER (Sponsored)
Binance Free $600 (CryptoPotato Exclusive): Use this link to register new account and receive $600 exclusive welcome offer on Binance (
full details).
LIMITED OFFER 2024 for CryptoPotato readers at Bybit: Use this link to register and open a $500 BTC-USDT position on Bybit Exchange for free!
Disclaimer: Information found on CryptoPotato is those of writers quoted. It does not represent the opinions of CryptoPotato on whether to buy, sell, or hold any investments. You are advised to conduct your own research before making any investment decisions. Use provided information at your own risk. See Disclaimer for more information.
Cryptocurrency charts by TradingView.