

Not much has changed since our last post. However, according to the chart’s structure, it looks as though a breakout can be expected to take place very soon.
BTC is still holding the support level of the 0.618-0.764 Fibonacci retracement level and above the horizontal support level of (from Daily chart) at the $3,600-$3,400 price level.
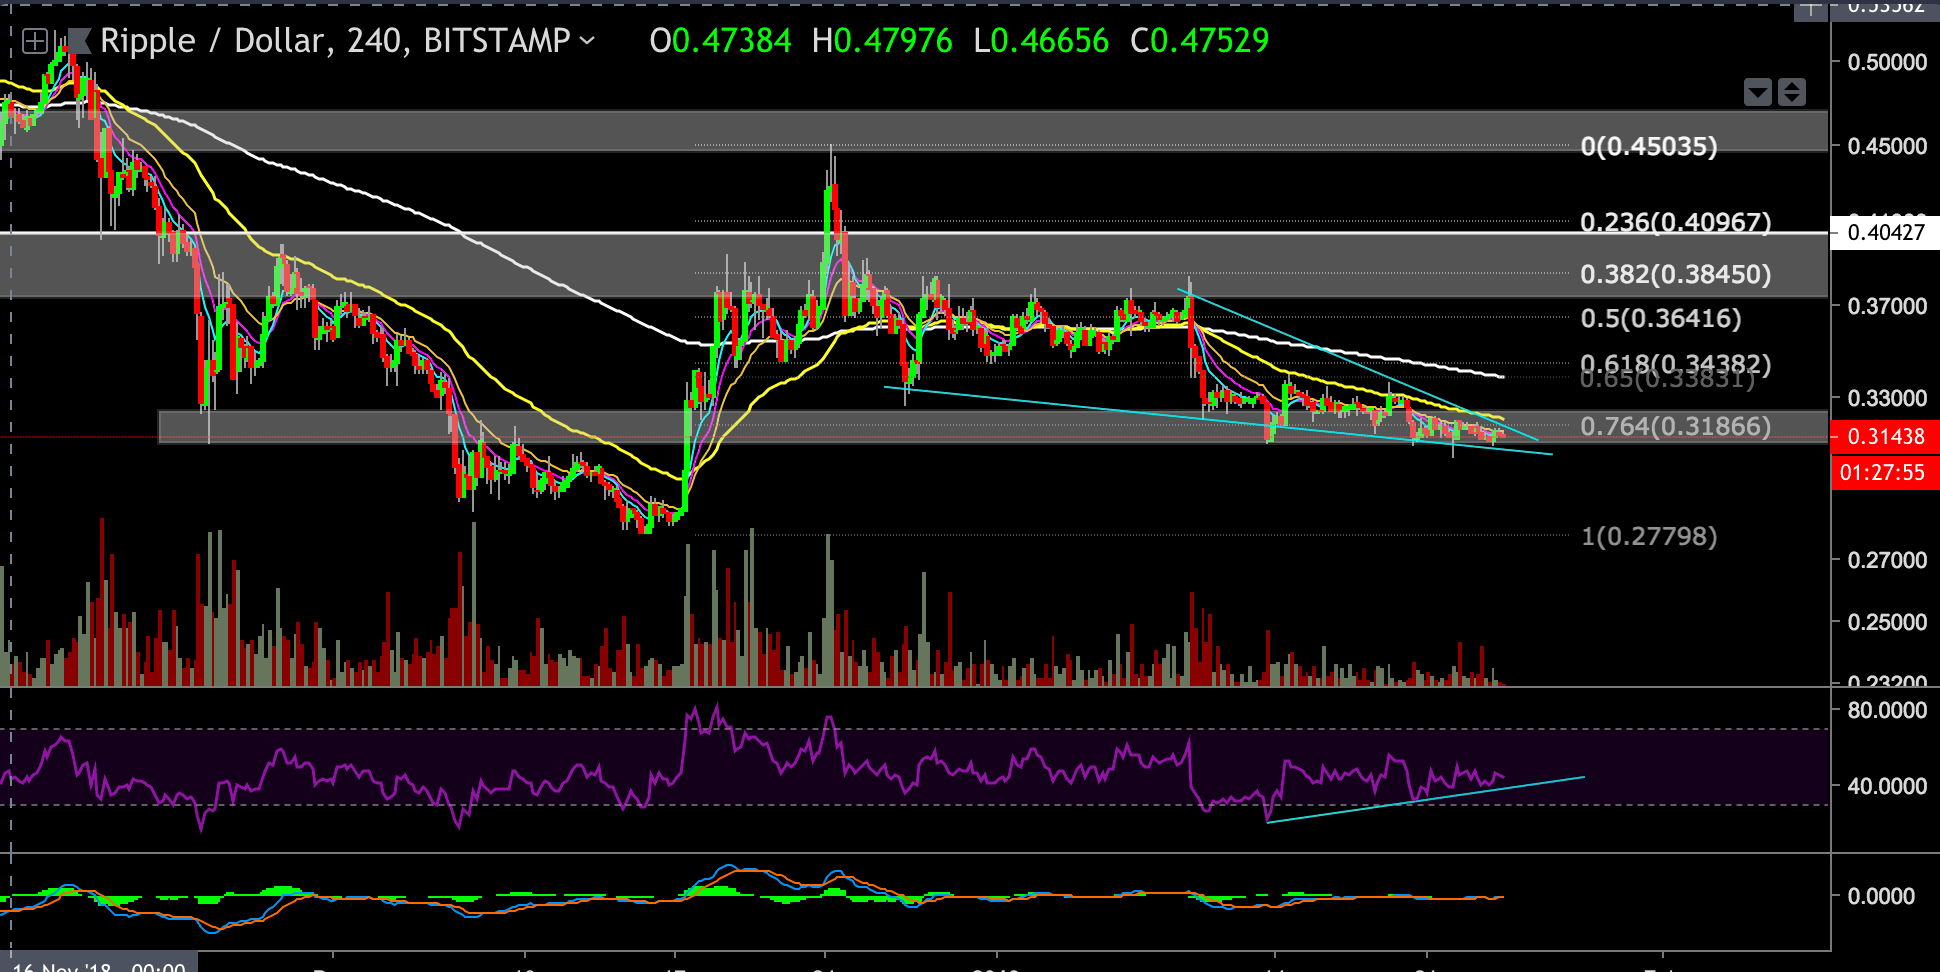
XRP is currently trading at the same levels as it did in our last analysis at the $0.31 price level.
This support level correlates with the 0.764 Fibonacci retracement level for XRP.
Looking at the 4-hour chart:
- At the time of writing, this post the XRP price is testing the $0.31 support level.
- A break of this support zone could send the XRP price is down towards the $0.2935 level or even lower at the $0.277 support level ( same targets as in our last analysis).
- From the bullish side, if the current support level holds and BTC chart chooses the bullish scenario, then the XRP price could rally toward the $0.35 or $0.37-$0.4 resistance level, as a starter.
- There is a descending diagonal formation that you can see on the 4-hour chart. Those types of formations are usually acting as a reversal formation with a bullish outcome, but in some cases, they work the other way around.
- Take into consideration that it might break, blow, and jump back up and create a hammer candle in order to catch the stop loss orders, and then move upward.
- RSI is holding the blue support trend line at the moment
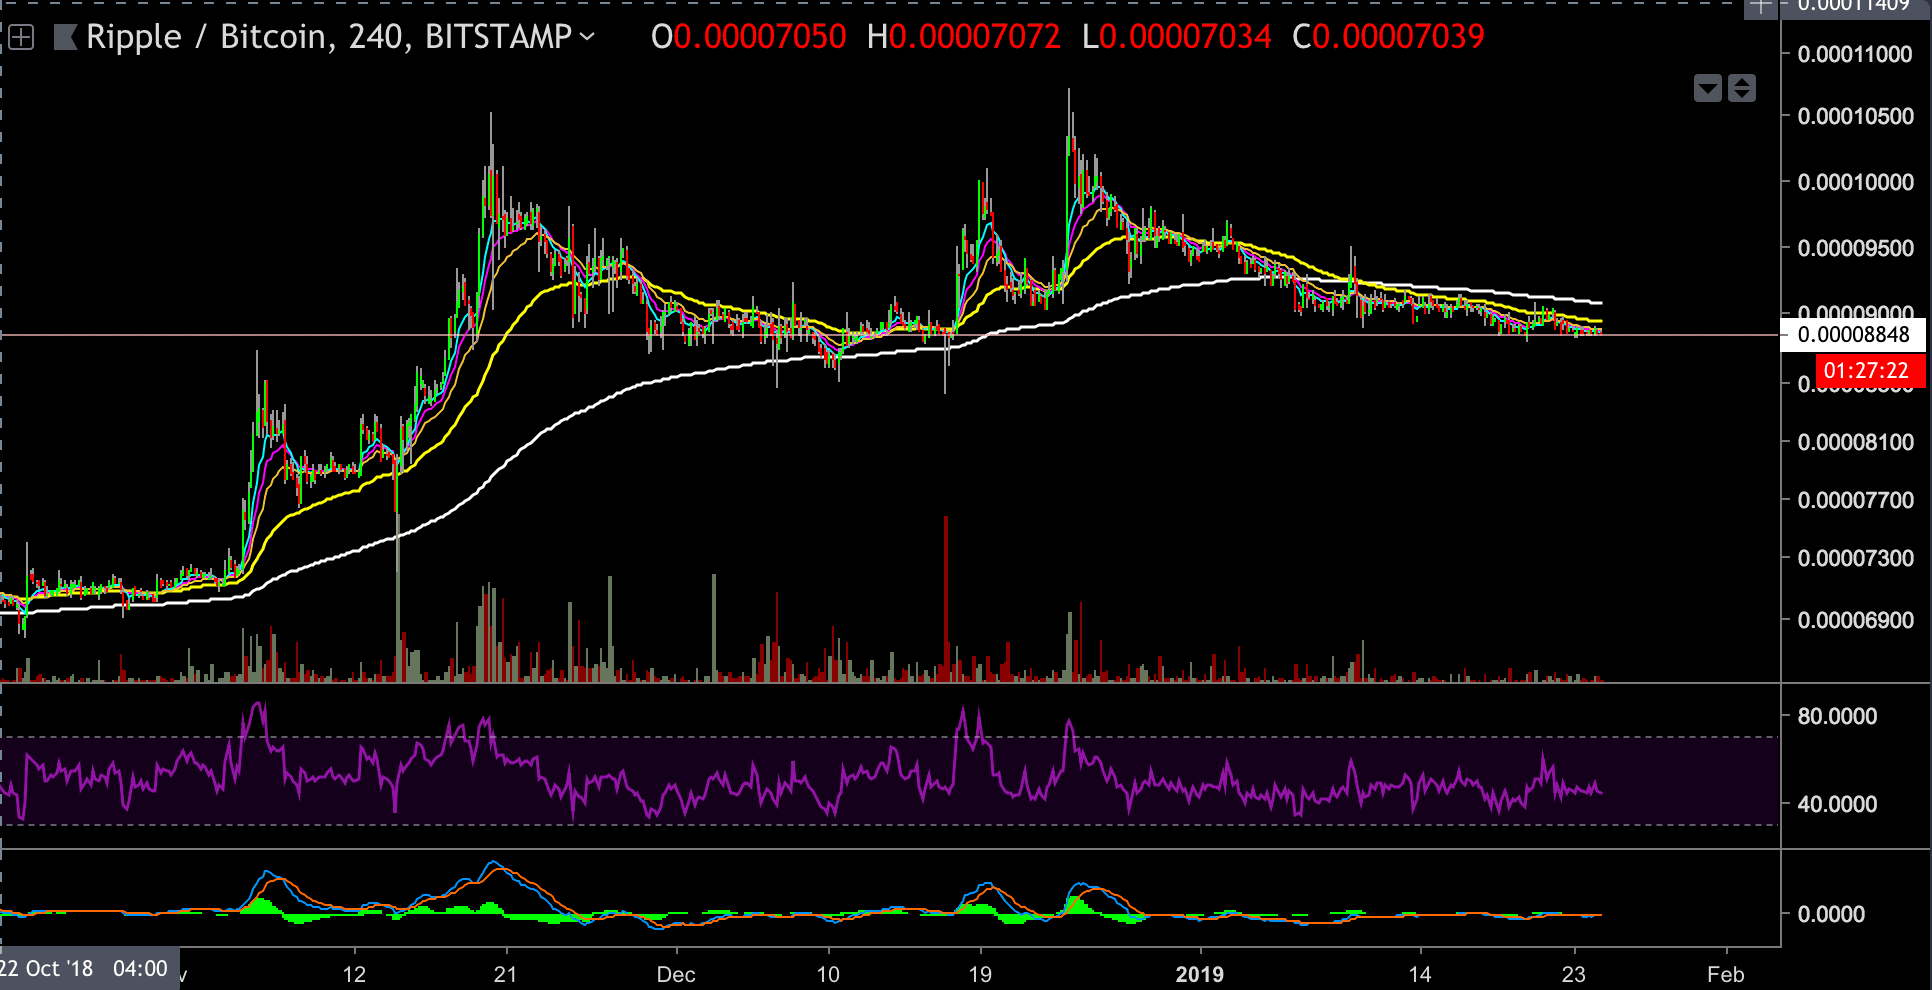
Looking at the XRP-BTC 4-hour chart
XRP is in a very important support zone, and if it breaks below it could trigger a strong bearish move or vice versa.
Disclaimer: Information found on CryptoPotato is those of writers quoted. It does not represent the opinions of CryptoPotato on whether to buy, sell, or hold any investments. You are advised to conduct your own research before making any investment decisions. Use provided information at your own risk. See Disclaimer for more information.
Cryptocurrency charts by TradingView.


