Not much has changed since our last price analysis for XRP: If we take a quick look over the BTC chart, we can notice that in the previous few days since January 11th, BTC has been trading around the 0.618 Fibonacci retracement level, which acted as a support level.
XRP chart is trading the same and is currently getting supported by the 0.764 Fibonacci retracement level.
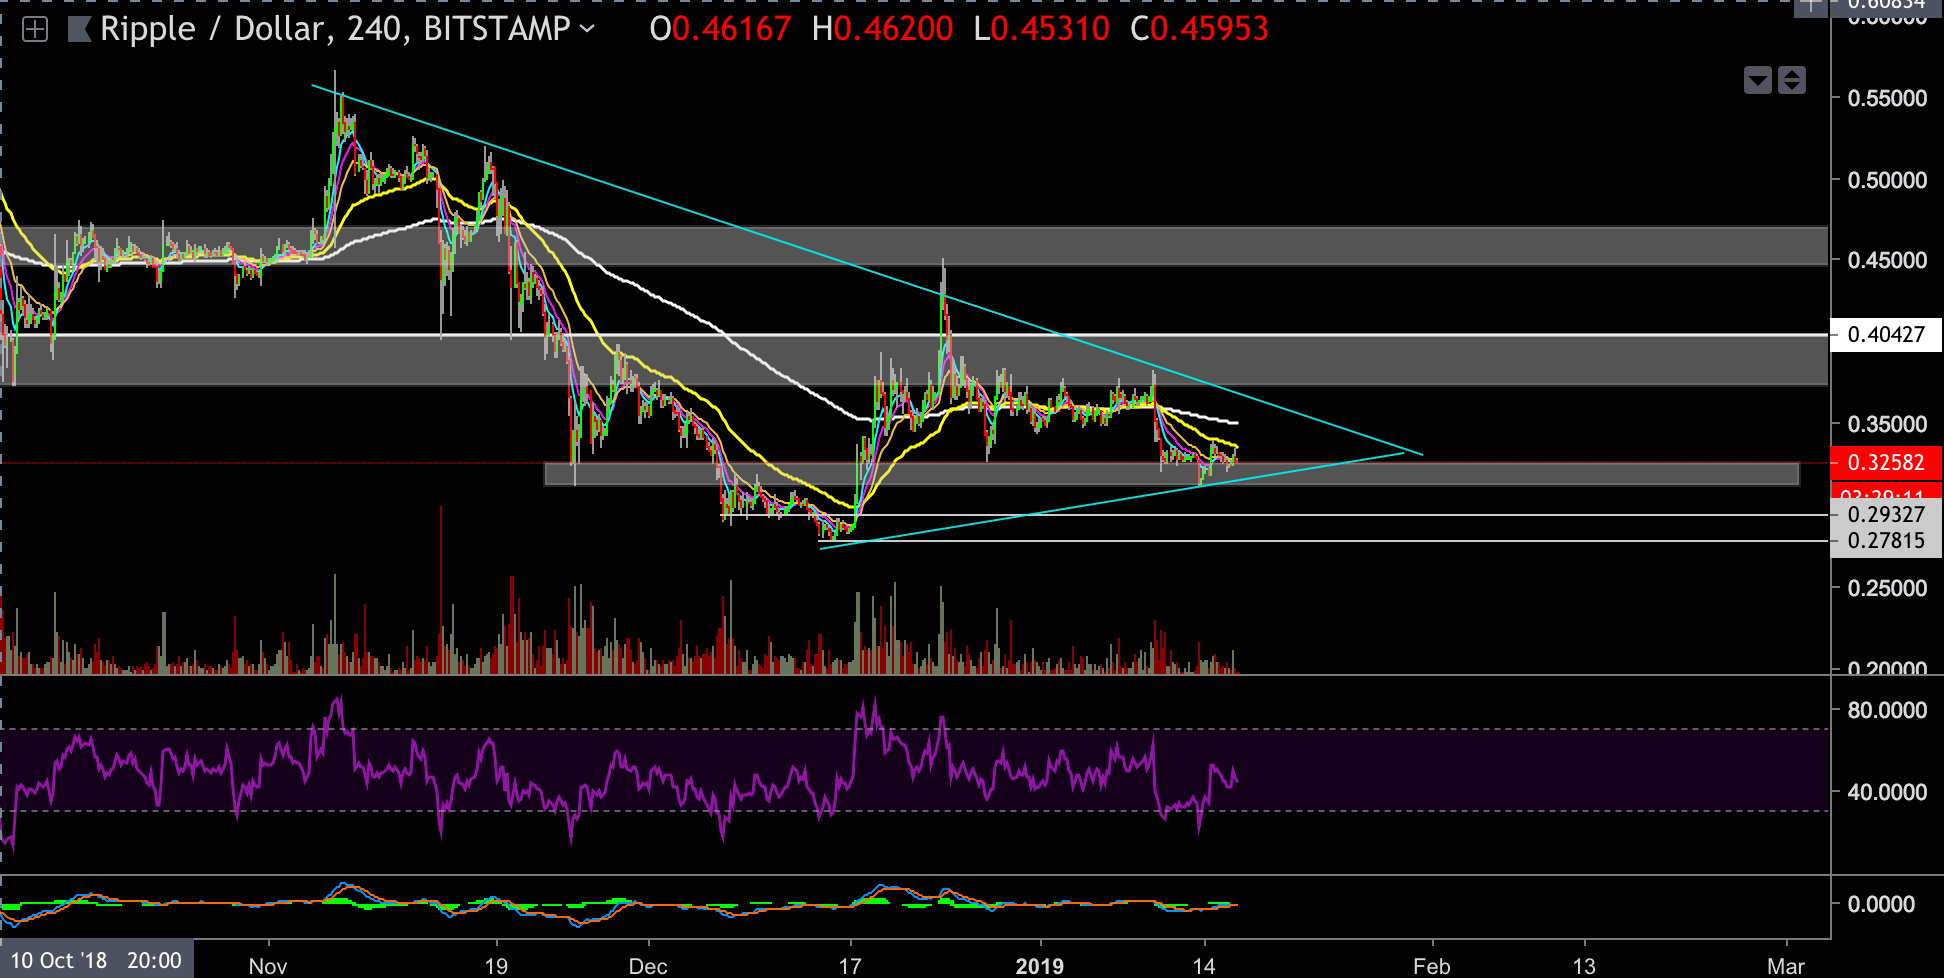
As we anticipated in our previous analysis, XRP had dropped precisely to the $0.31 price level where it found support and bounced back 7.5% to the $0.34 price level. From there, it got rejected and tested the support zone one more time.
Looking at the 4-hour chart:
- XRP is currently trading at the $0.327 price level while the 55 EMA is acting as a short-term resistance level.
- In case of a bullish break-out above the 55 EMA (the yellow lone on the attached chart), XRP could re-test the $0.35 price level at the middle part of the trading-channel, the point where the 200 EMA (the white line on the attached chart) is awaiting as resistance.
- On the other hand, if XRP breaks below the $0.31 support level, then the next target could be found at the $0.2935 level or even lower at the $0.277 support level which is the lowest price point of the last decline.
- The RSI indicator moved back into the neutral zone in the middle part of the channel after a drop to the oversold zones.
Notice that the BTC chart is currently showing lack of strength and in case that the bears manage to pull the price of BTC down toward the lower support levels, then it will affect the all crypto market, as always.
BitStamp XRP/USD 4-Hour Chart
SPECIAL OFFER (Sponsored)
Binance Free $600 (CryptoPotato Exclusive): Use this link to register new account and receive $600 exclusive welcome offer on Binance (
full details).
LIMITED OFFER 2024 for CryptoPotato readers at Bybit: Use this link to register and open a $500 BTC-USDT position on Bybit Exchange for free!
Disclaimer: Information found on CryptoPotato is those of writers quoted. It does not represent the opinions of CryptoPotato on whether to buy, sell, or hold any investments. You are advised to conduct your own research before making any investment decisions. Use provided information at your own risk. See Disclaimer for more information.
Cryptocurrency charts by TradingView.