During the last 24 hours, Bitcoin’s price made another leg down toward the 0.618 Fibonacci retracement level where it found temporary support and slightly bounced upward then.
This decline came after a few days of a narrow range price consolidation.
At the moment, BTC is trading around the $3550 price level where it is currently getting rejected and will probably try to retest the last low before choosing its next short term destination.
The 0.618 Fibonacci retracement level might turn out to be another bullish attempt to start a mini-rally, even though as of now it’s hard to say that.
Notice also that BTC price broke below the head and shoulders formation right-shoulder’s support level, but at the moment the structure is alive, while another move down will surely cancel this mentioned formation, so watch and follow.
Back to XRP
XRP is currently trading at the lower support level of the trading channel, between the $0.324-$0.31 price range.
If you followed our last analysis, then you probably noticed that this support level is where we pointed out that XRP would visit, in the case of a bearish breakout of the symmetrical triangle formation that was mentioned.
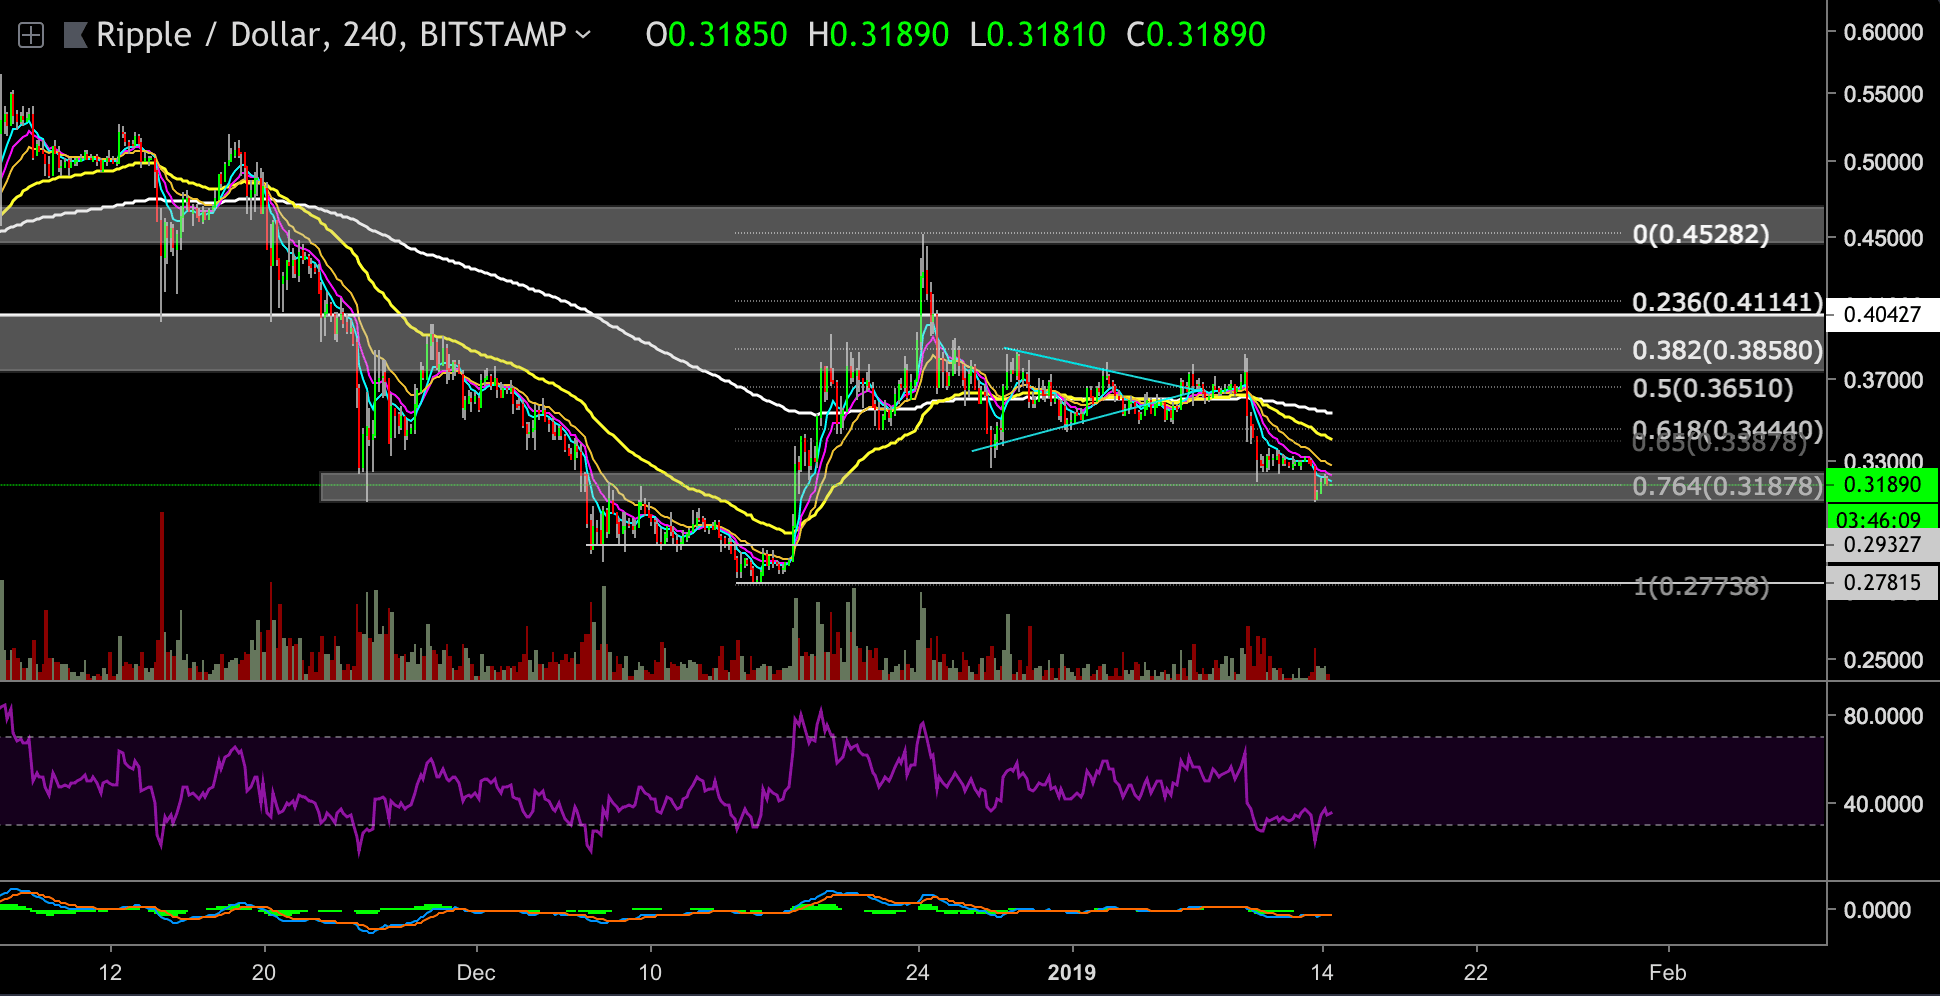
Looking at the 4-hour XRP-USD chart
- In case that XRP breaks below the $0.31 support, then the next target could be found at the $0.2933 area or lower at the $0.278 price level.
- XRP is trading around the 0.764 Fibonacci retracement level (calculated as a retracement of the last bullish move from $0.277 to $0.45).
- The 0.618 – 0.764 Fibb retracement level might be a convenient spot for bulls to bet on long position entry. Hence, if XRP finds the support needed and if BTC starts rallying (which now seems unlikely), then XRP could bounce upward toward the $0.353 resistance, located at the middle part of the trading channel on the following chart.
- XRP could even spike higher toward the $0.373 resistance level (but it is too early to discuss an option of recrossing to the higher side of the current trading channel)
- The 4-hour RSI indicator just climbed back up from the oversold regions and is now getting support above the 30 levels. We do not see any positive diversions at the moment, neither on the 4-hour nor on the 1-hour chart, which could signal that another decline is coming up.
- XRP is trading below all the EMAs which are acting as resistance levels.
- Testing of lower price levels shortly before a re-bounce is likely due to lack of bullish signals and lack of volume
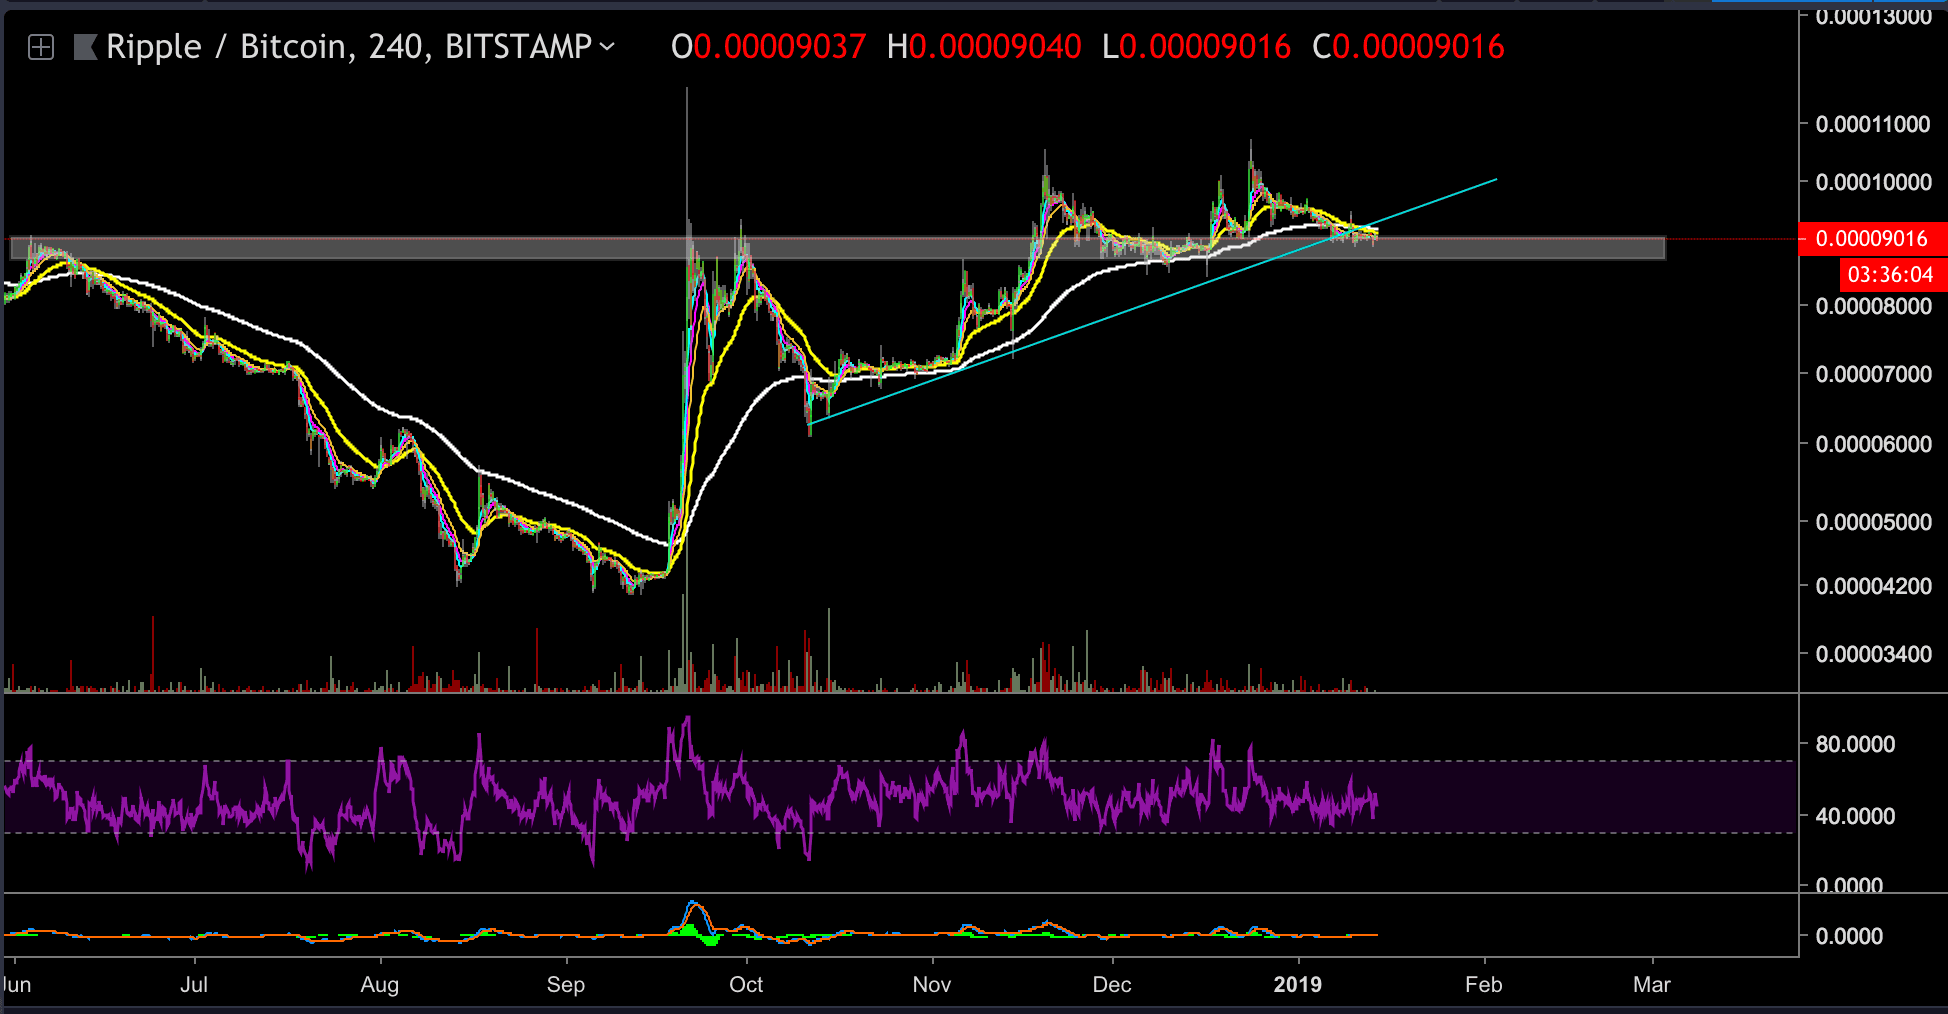
Looking at the 4-hour XRP-BTC chart
- XRP price broke below the blue ascending trend-line, for the first time since October 11th.
- XRP is currently testing a critical support level (the gray area), in case of a break down below this area XRP might drop another 15% (against BTC).
BitStamp XRP/USD 4-Hour Chart
BitStamp XRP/BTC 4-Hour Chart
SPECIAL OFFER (Sponsored)
LIMITED OFFER 2024 for CryptoPotato readers at Bybit: Use this link to register and open a $500 BTC-USDT position on Bybit Exchange for free!
Disclaimer: Information found on CryptoPotato is those of writers quoted. It does not represent the opinions of CryptoPotato on whether to buy, sell, or hold any investments. You are advised to conduct your own research before making any investment decisions. Use provided information at your own risk. See Disclaimer for more information.
Cryptocurrency charts by TradingView.