XRP/BTC. Source: TradingView
Key Support Levels: $0.27, $0.264, $0.256.
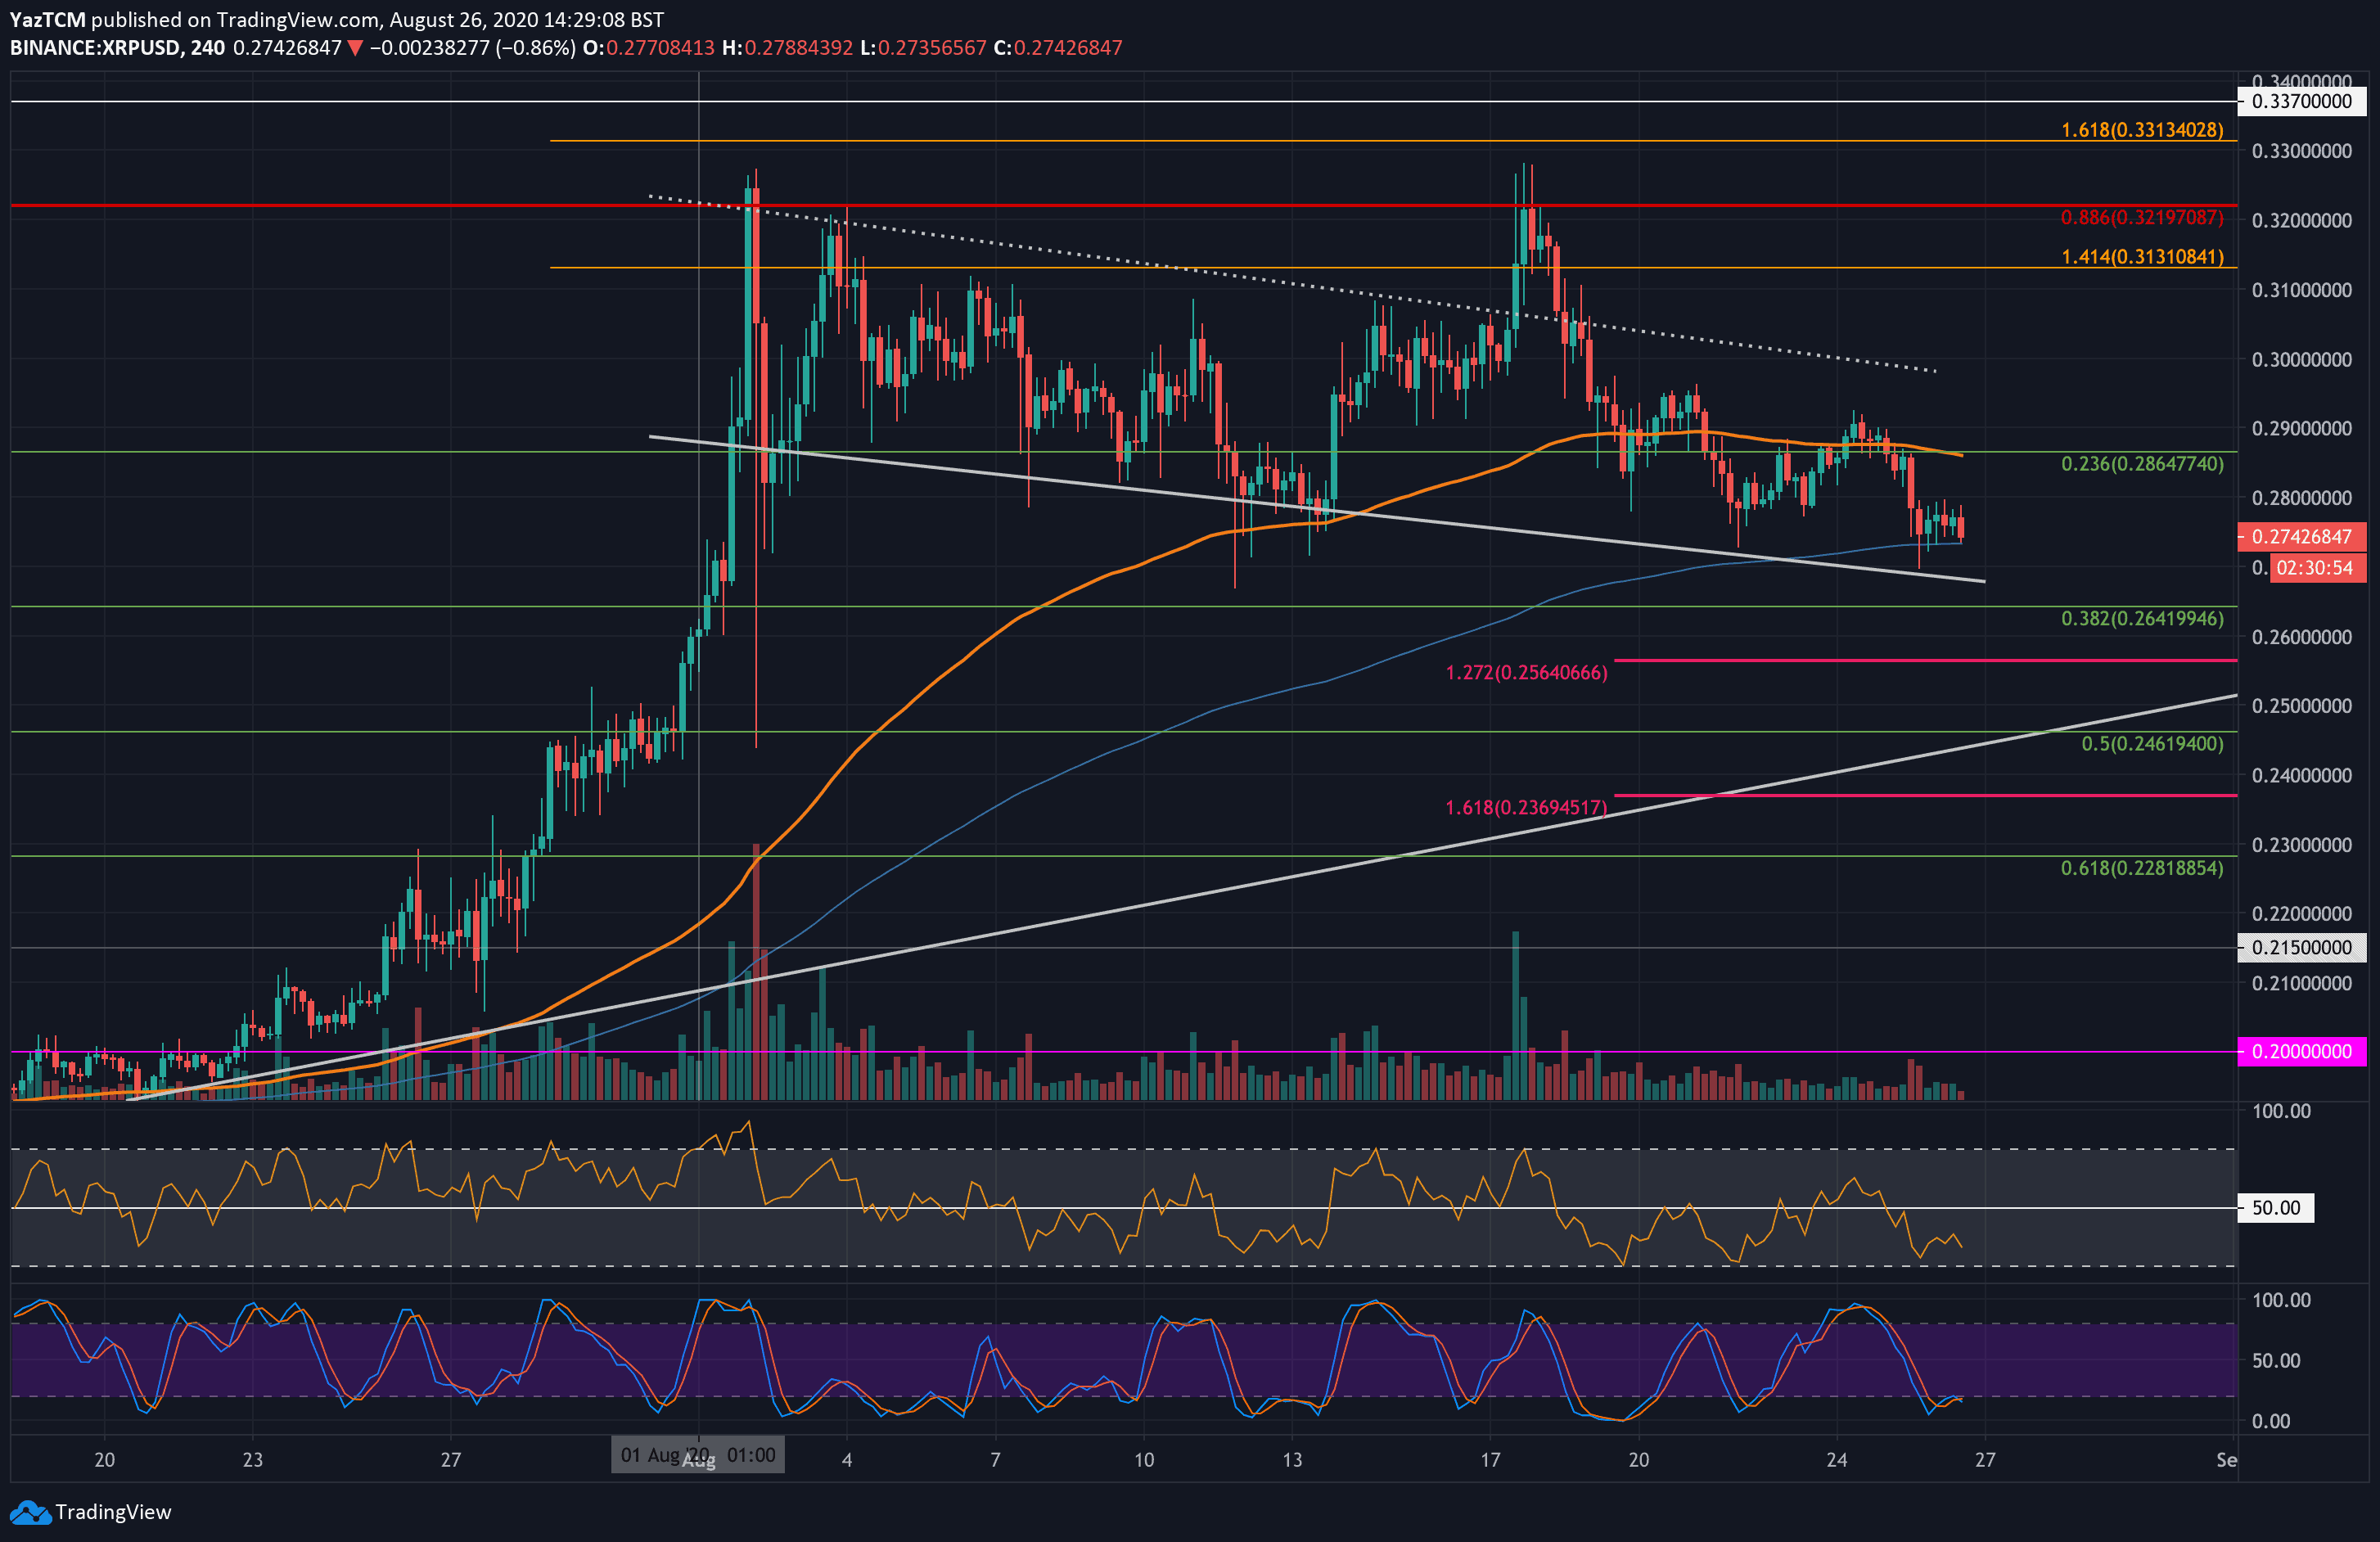
Key Resistance Levels: $0.286, $0.3, $0.313.
Since reaching the high-day close at $0.321 (bearish .886 Fib Retracement) earlier in the month, XRP has been on a steady decline. It had lost the critical support at $0.286 during the past week as the coin reached the lower boundary of the descending price channel yesterday.
Today, the buyers are struggling to defend the 4HR 200EMA level as XRP currently trades above it. However, with the on-going bearish momentum developing, XRP will likely break this support.
If the sellers push lower, support is first located at $0.27, the lower boundary of the falling price channel. Beneath this, support lies at $0.264 (.382 Fib Retracement), $0.256 (downside 1.272 Fib Extension), and $0.246 (.5 Fib Retracement). A 2-month-old ascending trend line further bolsters the support here.
On the other side, if the buyers can defend the 4HR 200EMA level and rebound, resistance lies at $0.286, $0.3 (upper boundary of the channel), and $0.321 (bearish .886 Fib Retracement).
Key Support Levels: 2400 SAT, 2333 SAT, 2275 SAT.
Key Resistance Levels: 2560 SAT, 2630 SAT, 2750 SAT
Against Bitcoin, XRP is trading sideways over the past few days as it ranges between 2500 SAT and 2400 SAT. The cryptocurrency is actually trading within a descending triangle pattern with the base of the triangle at 2400 SAT.
The market is approaching the apex of this pattern, where a breakout is expected. Typically, descending triangles are breaking to the downside; however, until the breakdown occurs, anything can happen.
Nevertheless, the support at 2435 SAT (.236 Fib Retracement) is currently being defended by the bulls.
If the sellers do push beneath the lower boundary of this triangle, support initially lies at 2333 SAT (.5 Fib Retracement). This is followed by support at 2275 SAT and 2200 SAT.
On the other side, resistance lies at the upper boundary of the triangle. This is followed by resistance at 2560 SAT, 2630 SAT (bearish .5 Fib Retracement), and 2750 SAT.
The Stochastic RSI is approaching oversold conditions on the 4HR timeframe, which could indicate that the selling pressure is ready to ease.