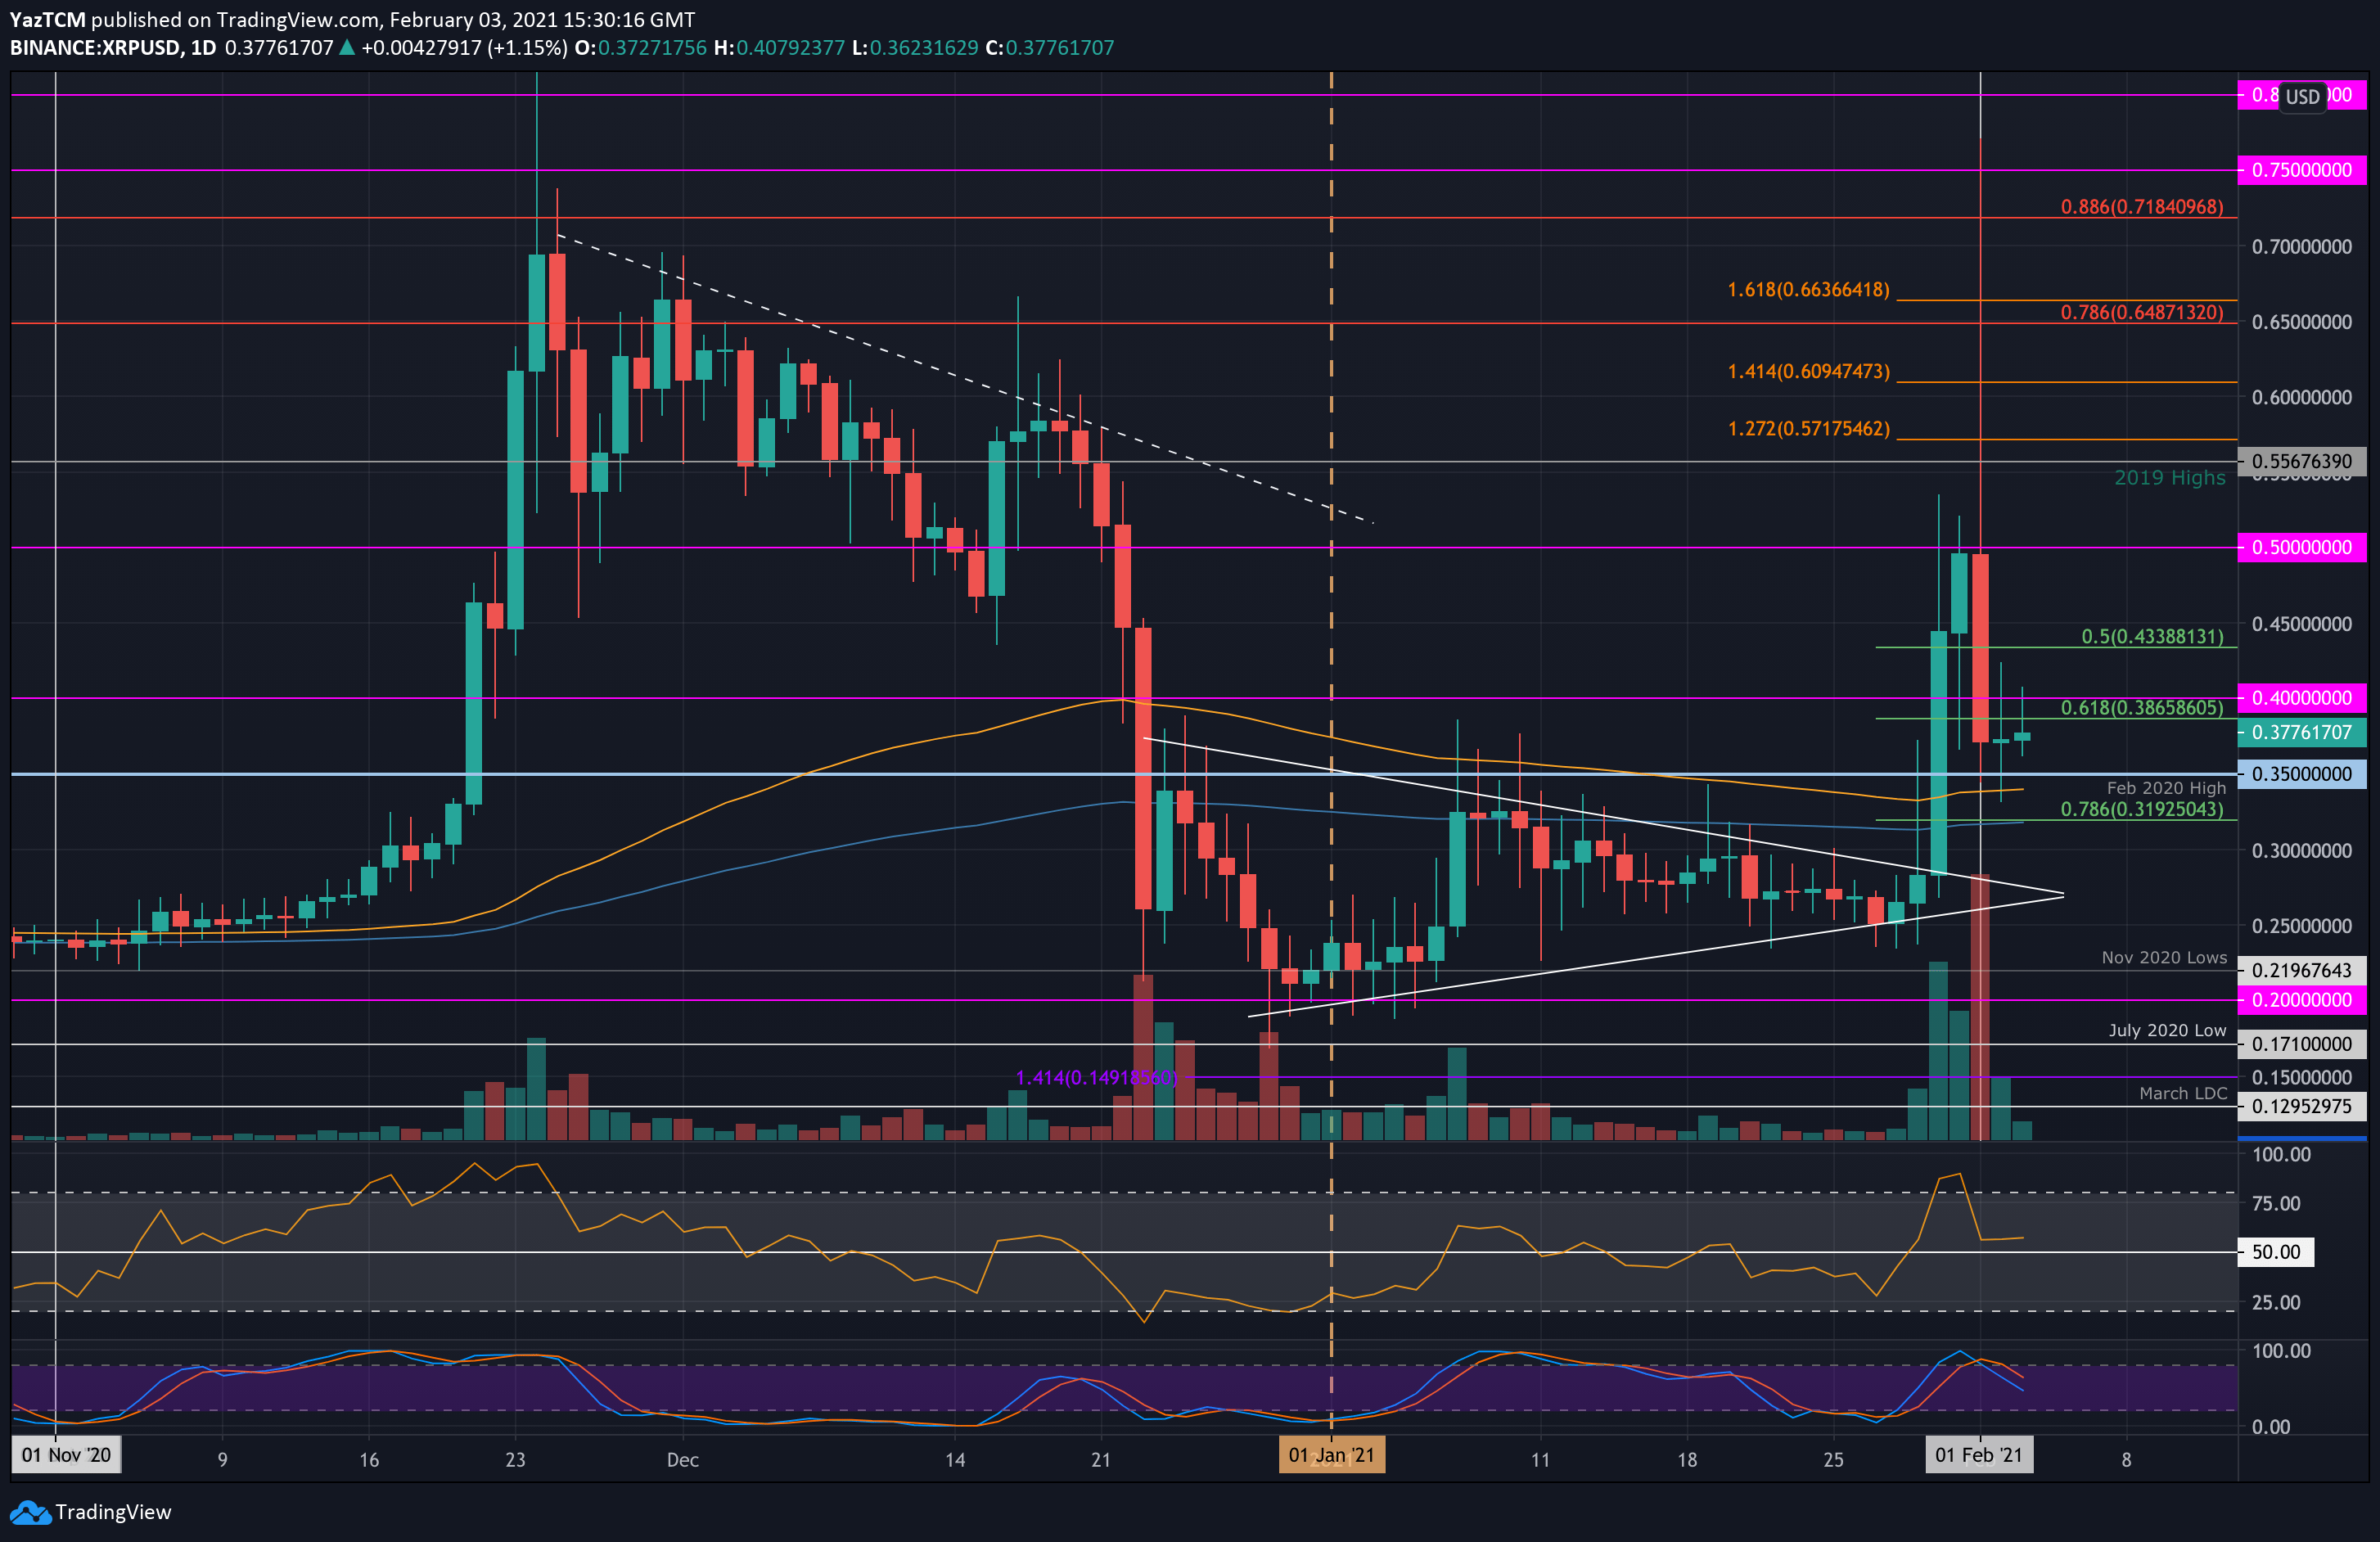
XRP/USD Daily Chart. Source: TradingView
Key Support Levels: $0.27, $0.35, $0.319.
Key Resistance Levels: $0.4, $0.45, $0.5.
XRP has been on an epic rollercoaster of the last week of trading. The coin had managed to penetrate above a symmetrical triangle toward the end of January as it started its bullish surge higher toward $0.5.
On the 1st of Feb, XRP exploded higher to reach $0.77. However, by the end of the day, it quickly came crashing down as it dropped 52% from the high to close the candle at around $0.37.
Over the past two days, the bulls have battled to hold the support around the $0.37 level.
Looking ahead, the first level of strong resistance lies at $0.4. This is followed by resistance at $0.45, $0.5, and $0.445 (2019 Highs).
On the other side, the first support lies at $0.37. This is followed by $0.35 (Feb 2020 highs), $0.319 (.786 Fib & 200-days EMA), and $0.3.
The RSI remains in the bullish favor as it sits marginally above the midline. To recover back above $0.5, the RSI must start rising to indicate increased bullish momentum.
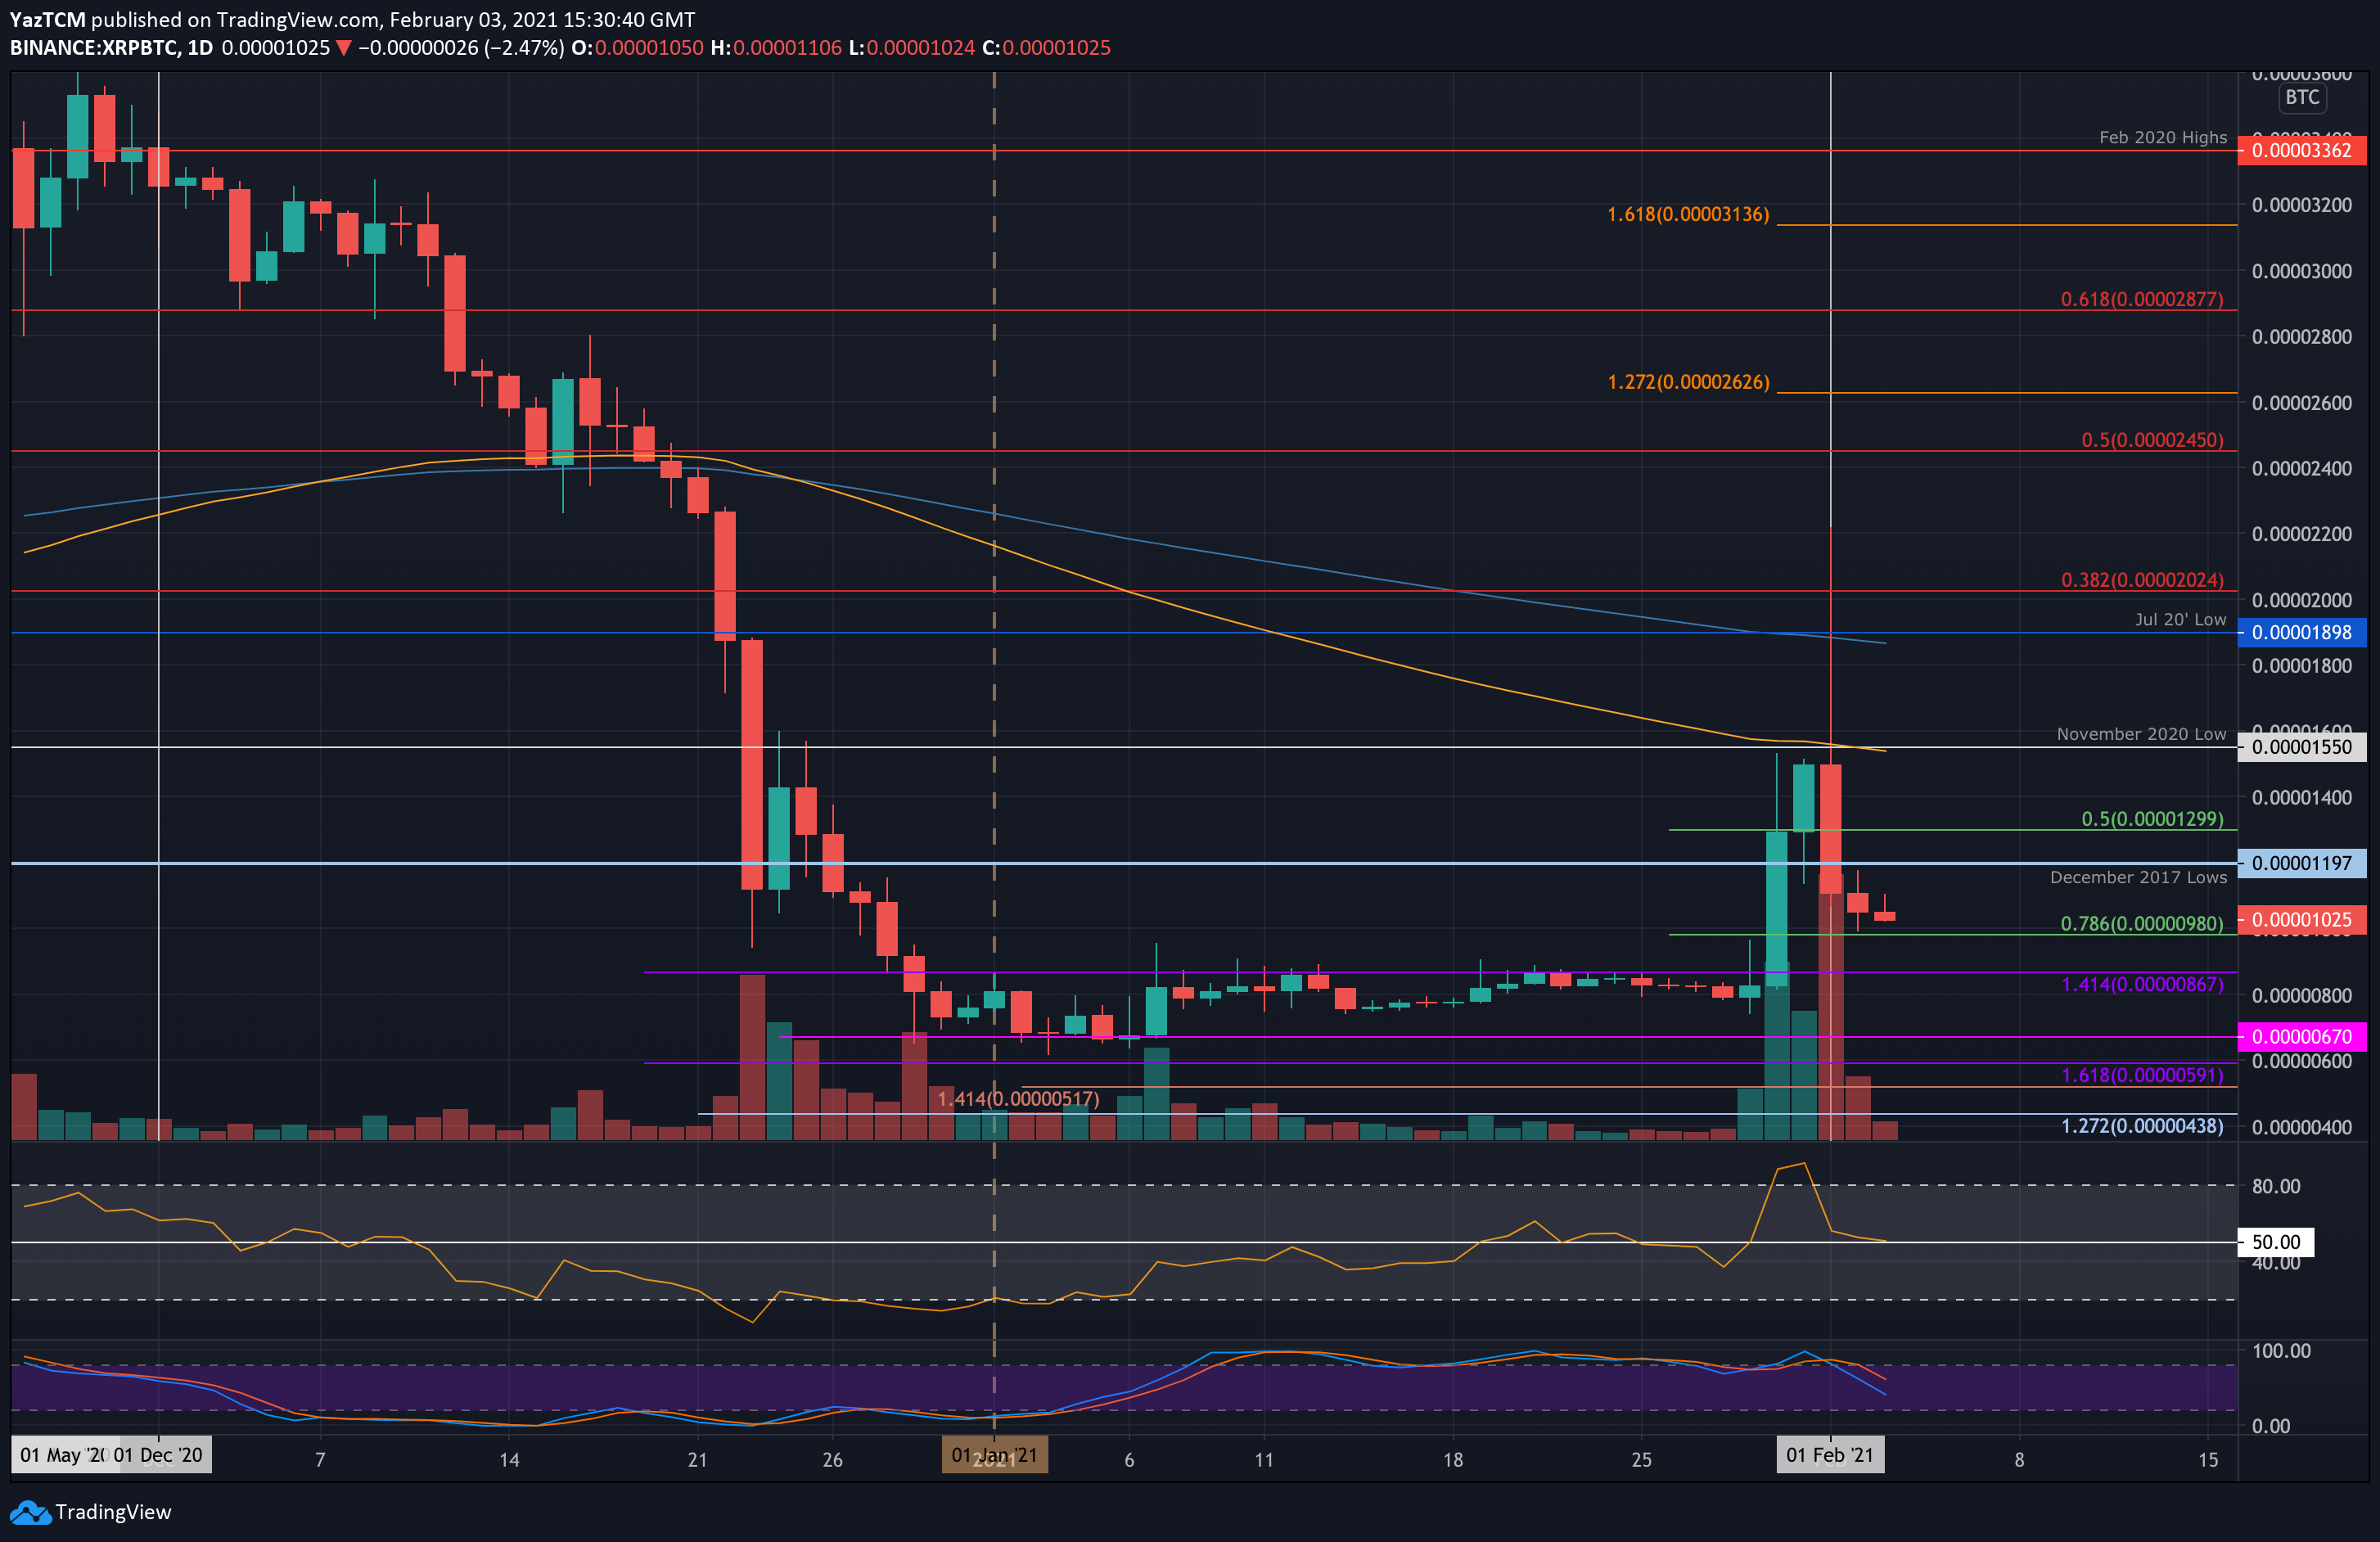
Key Support Levels: 1000 SAT, 980 SAT, 867 SAT.
Key Resistance Levels: 1200 SAT, 1550 SAT, 1900 SAT.
Against Bitcoin, XRP had also surged higher over the past week. Over the weekend, it managed to break the January range as it smashed above the 867 SAT resistance. It continued higher to reach 1550 SAT by the end of the weekend.
On Monday, when XRP surged as high as $0.77, XRP/BTC managed to reach 2200 SAT. From there, it quickly headed lower as it began to plummet.
It managed to find support at 980 SAT (.786 Fib) yesterday and is battling to remain above 1000 SAT today.
Moving forward, the first resistance lies at 1200 SAT (December 2017 lows). This is followed by resistance at 1550 SAT (November 2020 low & 100-days EMA) and 1900 SAT (July 2020 low & 200-days EMA).
On the other side, the first support lies at 1000 SAT. This is followed by 980 SAT (.786 Fib), 867 SAT (previous range resistance), 750 SAT, and 670 SAT (previous range support).
The RSI has returned to the midline, indicating indecision within the market. If it drops beneath 50, the bearish momentum will increase and likely push XRP/BTC beneath the 980 SAT support.