The price of Ripple’s XRP token has tumbled by 12% throughout the past 24 hours of trading to around $0.42. Although the cryptocurrency has been struggling against BTC throughout 2019, this most recent decline is a result of Bitcoin having dropped by about 8%.
XRP has experienced an approximately 38% price increase over the past three months, poor when compared with its largest cryptos competitors Ethereum (+116%) and Bitcoin Cash (+152%). So far this month, XRP has managed to close above significant resistance around $0.46 and even created a fresh 2019 high at $0.5504.
XRP continues to hold the #3 position amongst the largest projects by market cap, coming in at $18 billion.
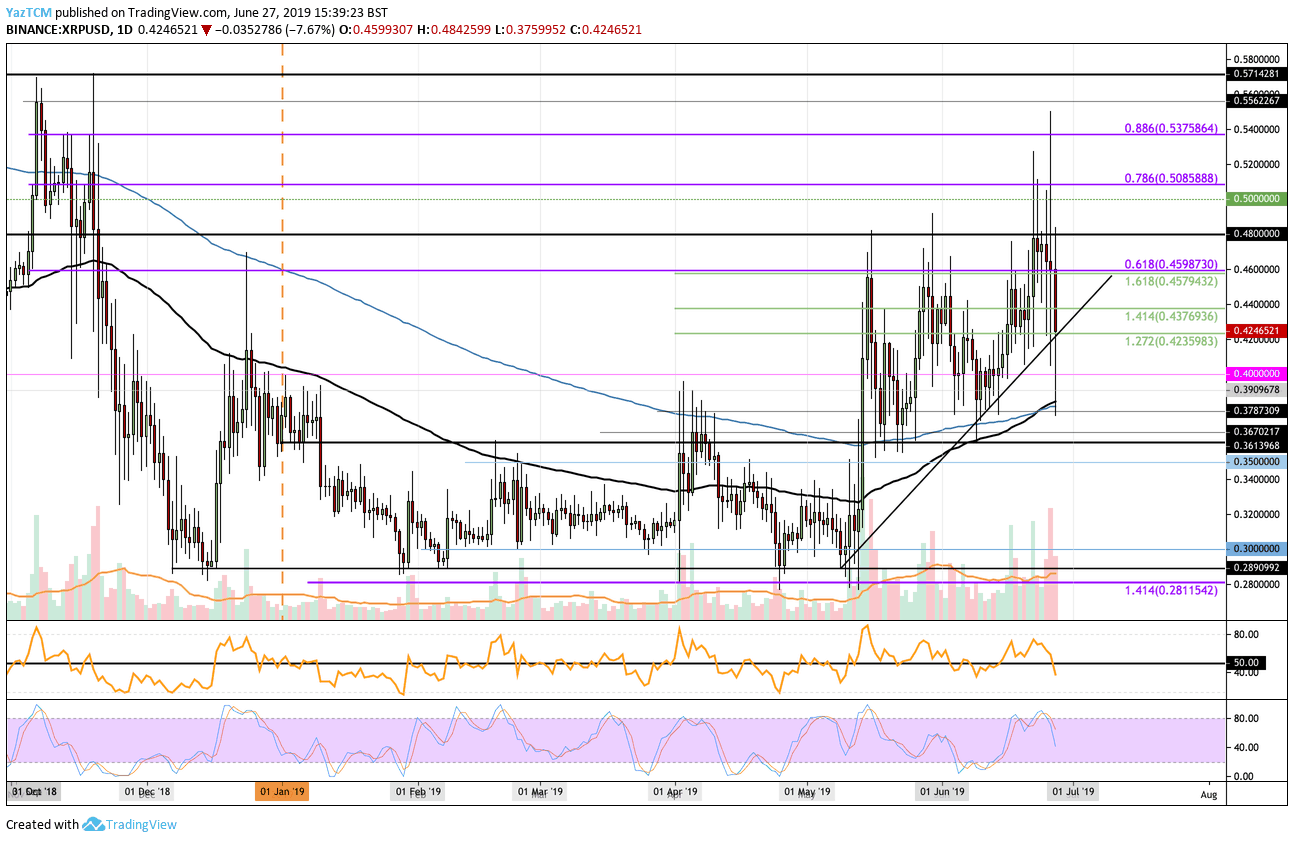
Looking at the XRP/USD 1-day chart:
- Since our previous XRP/USD analysis, XRP has failed to remain above the $0.48 resistance level. The token recently found some form of support at a rising support trend line, after dipping much lower only to rebound around the 200-day EMA at $0.3790.
- From above: The nearest level of resistance now lies at $0.44. Above this, we can find higher resistance at $0.46 and $0.48. If the bulls can break above the $0.48 resistance, further resistance levels lie at $0.50, $0.5085, $0.52, $0.56 and $0.5550.
- From below: The nearest level of support lies at the rising trend line. Beneath this, further significant support lies at $0.40, $0.39, $0.378 (both the daily 100 EMA and 200 EMA) as well as $0.36.
- The trading volume has increased sharply during the past few days of bearishness.
- The RSI recently dropped beneath the 50 level, indicating that the bears have taken control of the market. Furthermore, the Stochastic RSI recently produced a bearish crossover signal, resulting in the price falling even further.
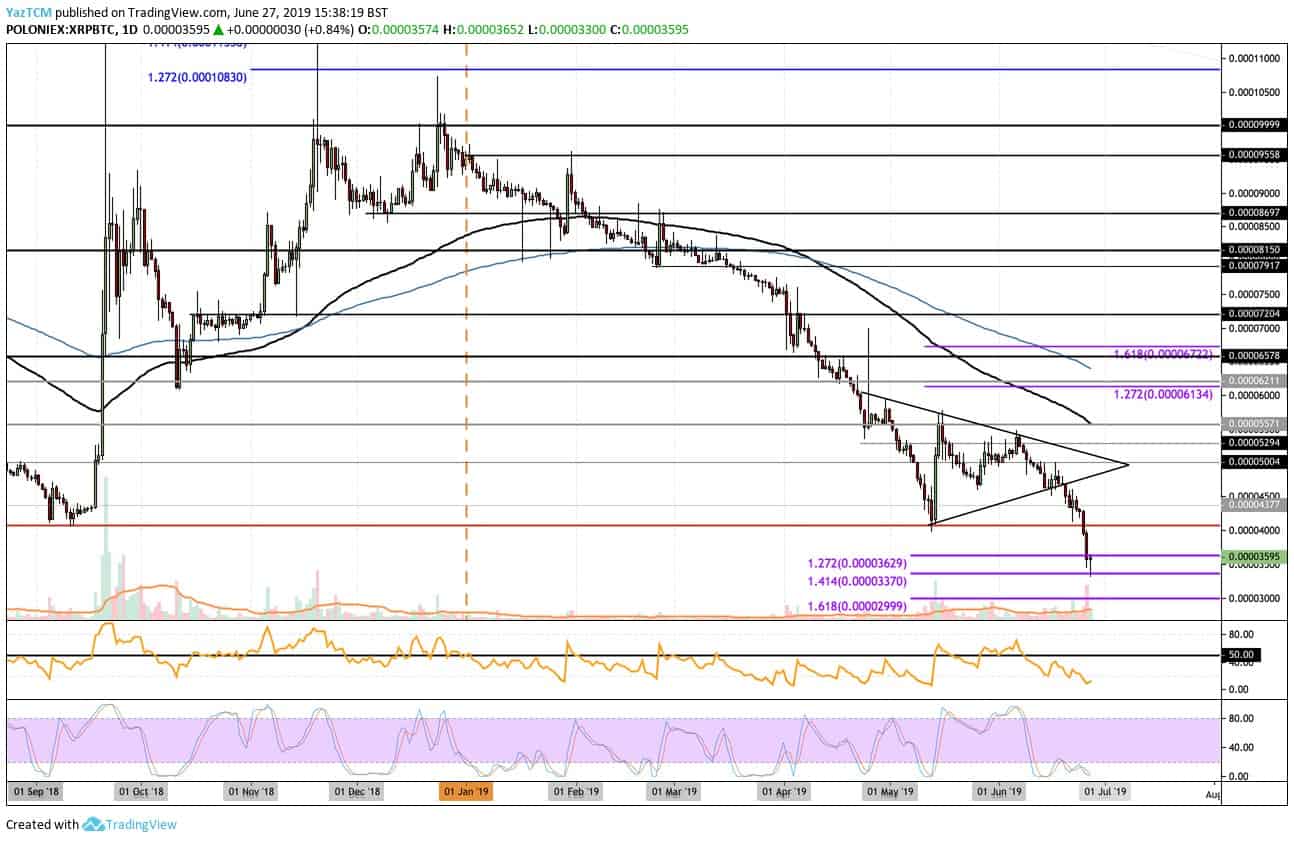
Looking at the XRP/BTC 1-day chart:
- Against Bitcoin, XRP has fallen much lower than our mentioned support at the 4,000 satoshi level, which provided strong support for the market in September 2018. More recently, XRP has continued to fall until finding support at 3,370 sat (downside 1.414 Fib extension level) where a rebound was seen.
- From above: The nearest level of resistance now lies at 3,630 sat followed by support-turned-resistance at 4,000 sat. Higher resistance is located at 4,375 sat, 5,000 sat, 5,300 sat, and 5,570 sat (the 100-day EMA).
- From below: The nearest level of support now lies at 3,370 sat. Beneath this, further support can be expected at 3,300 sat, 3,200 sat, 3,100 sat and 3,000 sat.
- The Stochastic RSI is currently in extreme oversold conditions but has been here for a few weeks now. We will be waiting for the bullish crossover.
SPECIAL OFFER (Sponsored)
LIMITED OFFER 2024 for CryptoPotato readers at Bybit: Use this link to register and open a $500 BTC-USDT position on Bybit Exchange for free!
Disclaimer: Information found on CryptoPotato is those of writers quoted. It does not represent the opinions of CryptoPotato on whether to buy, sell, or hold any investments. You are advised to conduct your own research before making any investment decisions. Use provided information at your own risk. See Disclaimer for more information.
Cryptocurrency charts by TradingView.