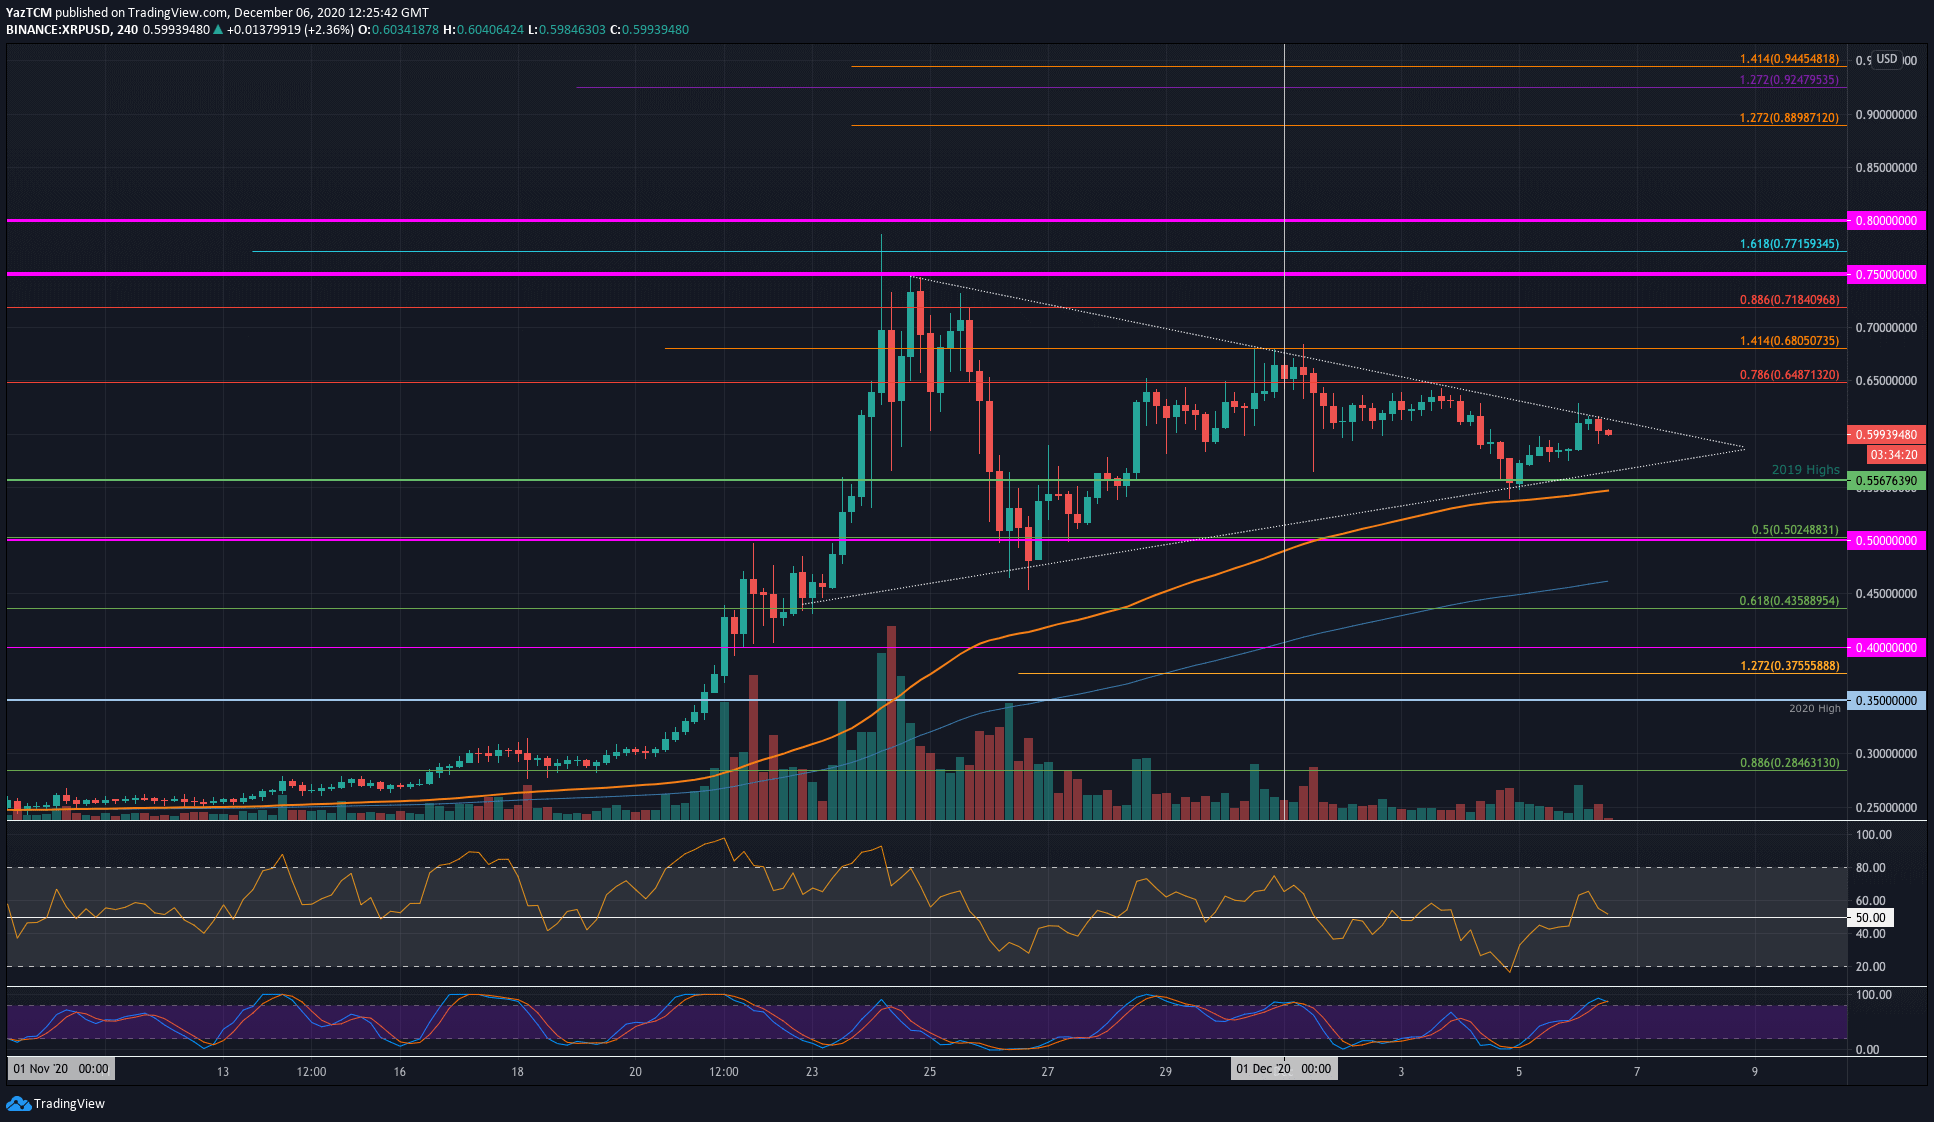
XRP/USD 4HR Chart. Source: TradingView
Key Support Levels: $0.556, $0.5, $0.435.
Key Resistance Levels: $0.65, $0.68, $0.718.
XRP struggled to break resistance at $0.68 at the start of December. From there, the coin started to head lower until it found support at the 2019 High, around $0.556 on Saturday. This support was further bolstered by the lower boundary of a symmetrical triangle that XRP has traded inside for the past fortnight.
XRP bounced higher from the lower boundary of this triangle to meet the upper boundary’s resistance today. It would need to break toward the upside to see it recover back toward $0.75 next.
Looking ahead, if the bulls can break the upper boundary of the triangle, the first level of resistance lies at $0.648 (bearish .786 Fib Retracement). This is followed by $0.68 (1.414 Fib Extension), $0.718 (bearish .886 Fib), and $0.75.
On the other side, the first level of support lies at the lower boundary of the triangle. This is followed by $0.556 (2019 Highs), $0.5 (.5 Fib), and $0.435 (.618 Fib).
The 4HR Stochastic RSI is primed for a bearish crossover signal that might send XRP to the triangle’s lower boundary.
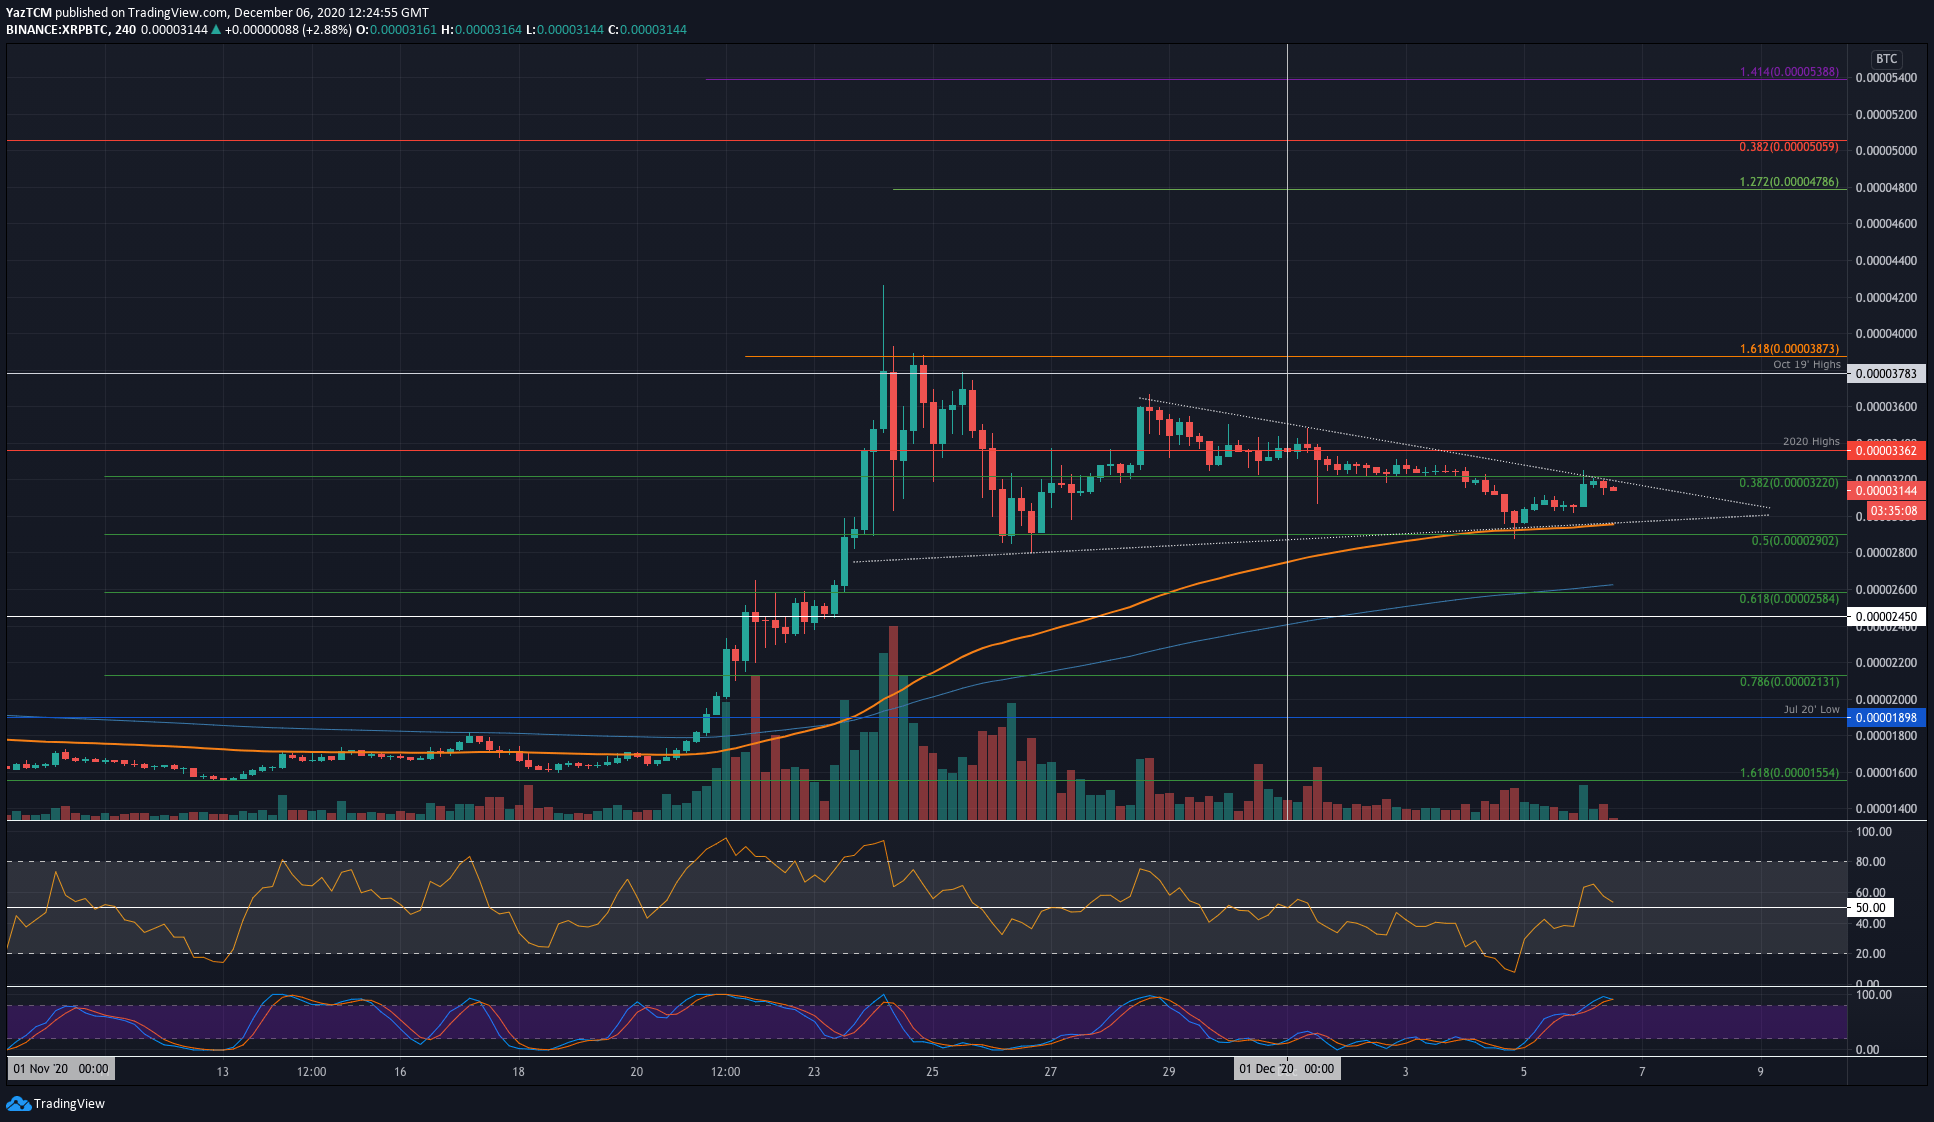
Key Support Levels: 3000 SAT, 2900 SAT, 2800 SAT.
Key Resistance Levels: 3220 SAT, 3362 SAT, 3600 SAT.
Against Bitcoin, XRP is also trapped in its own consolidation pattern as it trades within the boundaries of a shorter symmetrical triangle. The coin has been rangebound between 3400 SAT and 2900 SAT for the period of December.
Yesterday, the buyers found support at 2900 SAT (.5 Fib & Lower boundary of the triangle), which allowed it to rebound higher. Today, it returned to the upper boundary of the triangle but still needs to break toward its upside.
Looking ahead, if the buyers break the upper boundary of the triangle and 3220 SAT, resistance is expected at 3362 SAT. This is followed by 3600 SAT, 3785 SAT (October 2018 Highs), and 4000 SAT.
On the other side, the first level of support lies at 3000 SAT (lower boundary of the triangle). Beneath this, support lies at 2900 SAT (.5 Fib), 2800 SAT, and 2585 SAT (.618 Fib).
Likewise, the 4HR Stochastic RSI also produced a bearish crossover signal that might send the coin to the lower boundary of the consolidation pattern.