Everybody in the crypto market is still waiting to see what Bitcoin do next. In the last 24 hours, BTC price re-tested the supporting descending trend line while the volume diminished.
Not much is happening at the moment, and the big question is, will BTC fall lower to retest the $3,000? Or will we get some sort of bullish bounce from the current price levels? The big alts, including XRP, are following BTC price with its ‘boring’ sideways action.
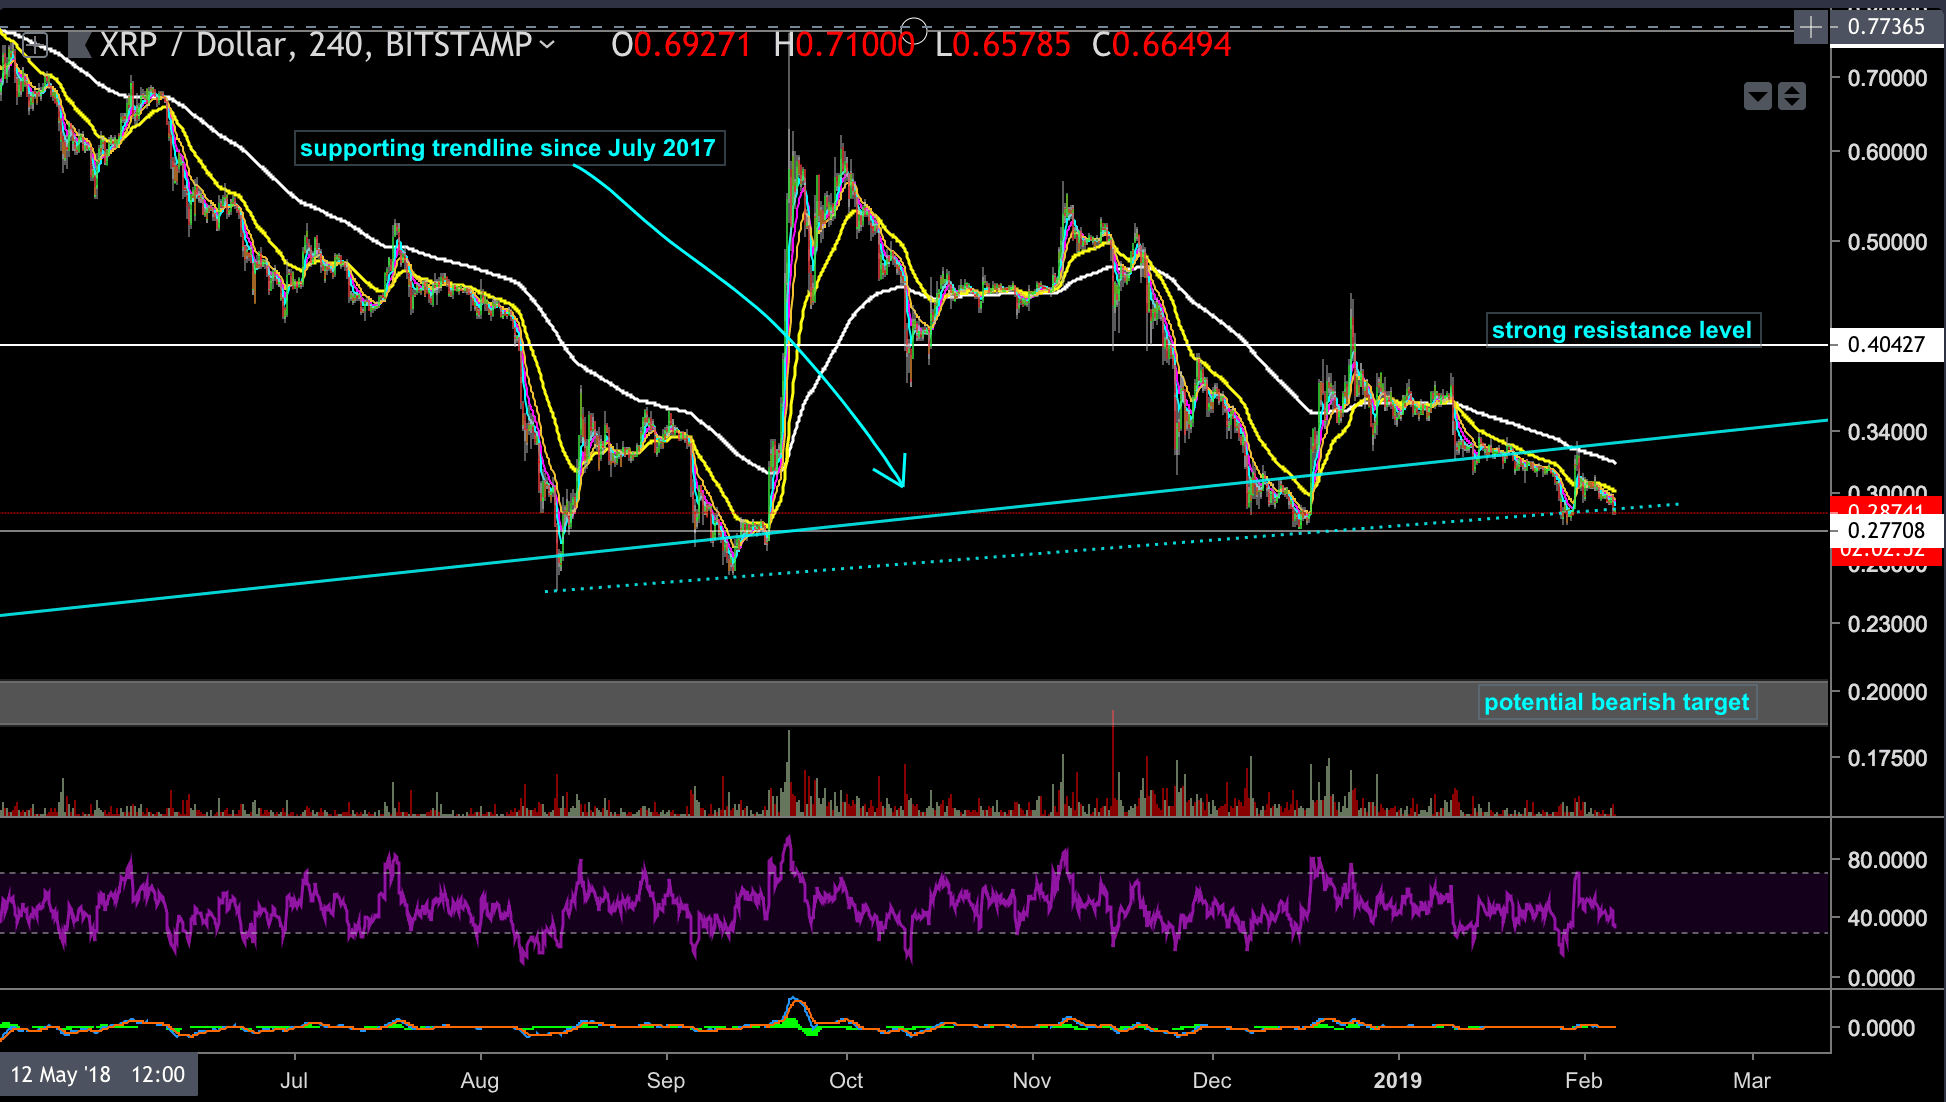
XRP is currently trading at the $0.287 price level
Looking at the 1-day and 4-hour XRP-USD chart
- XRP is currently testing the very important daily chart support trend line that has held the XRP price since July 2017. It is the 8th time that this supporting trend line is being tested.
- In case of a decisive break below this level, XRP could decline sharply and aggressively, toward the next target that could be found at the $0.20-$0.187 level, which is a 30% move.
- On the other hand, if the bulls show up with their guns to protect those price levels, XRP could get a bounce towards the $0.40 resistance level (an important price level for XRP that was mentioned in our previous posts). However, it looks as if there are a lot of mini resistance levels between the current price and $0.40, so even in the bullish scenario, we do not think there’s much chance of a quick rally.
- The daily RSI is at the lower part of the channel with suggested bearishness.
- Taking a closer look at the 4-hour chart, we can see that the daily support trend line could have been broken already and now is being retested at another support level; in that case, the bearish scenario is even more likely.
- Notice as well the potential head and shoulders formation on the daily chart, a very big one that supports the decline scenario. The mentioned supporting trend line is the neckline of this formation, and a break below could be the trigger for this formation.
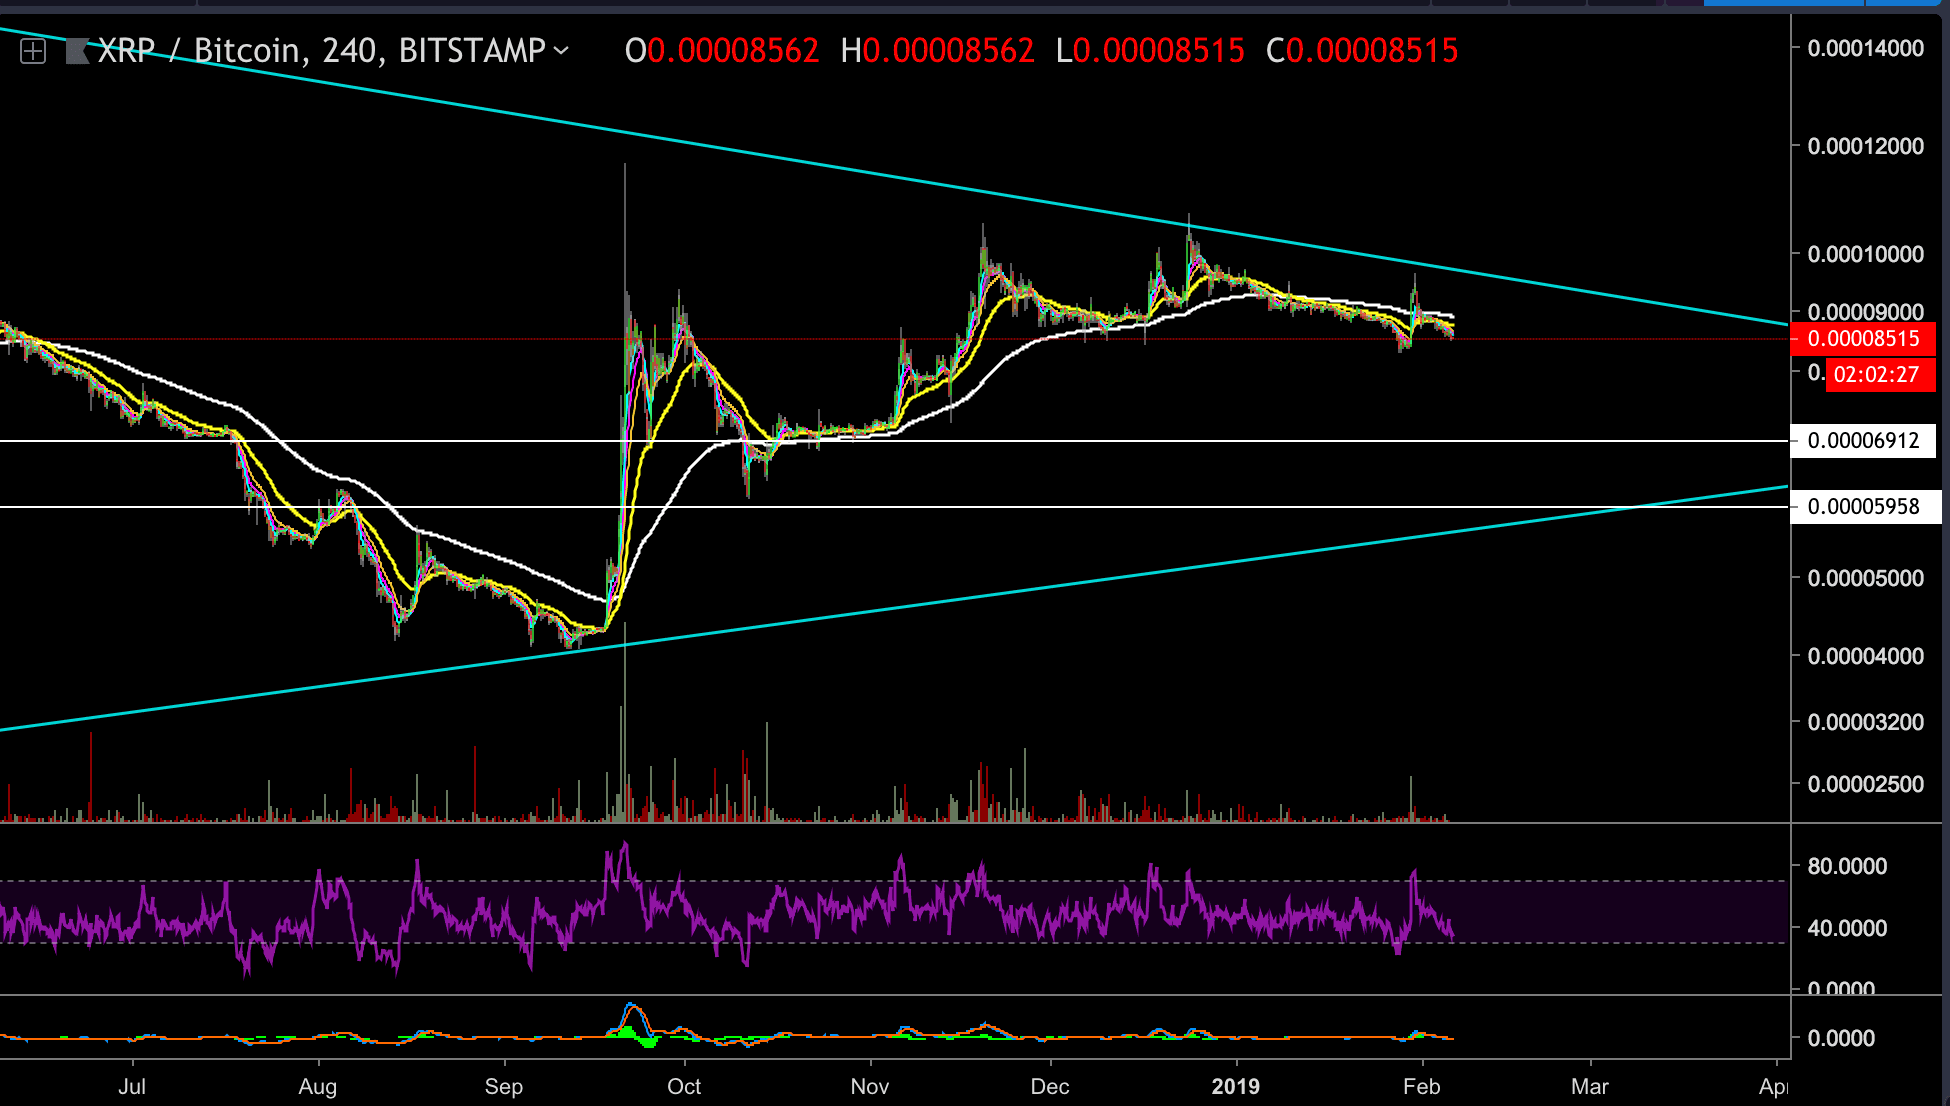
Looking at the XRP-BTC 4-hour chart
- Notice the blue support and resistance trend lines that create a sort of a triangle.
- XRP got rejected by the resisting trend line and is likely to decline toward the formation support level or toward the horizontal support levels that are marked in white on the attached XRPBTC chart
XRP-USD 1-Day chart
XRP-USD 4-Hour chart
XRP-BTC 4-Hour chart
SPECIAL OFFER (Sponsored)
LIMITED OFFER 2024 for CryptoPotato readers at Bybit: Use this link to register and open a $500 BTC-USDT position on Bybit Exchange for free!
Disclaimer: Information found on CryptoPotato is those of writers quoted. It does not represent the opinions of CryptoPotato on whether to buy, sell, or hold any investments. You are advised to conduct your own research before making any investment decisions. Use provided information at your own risk. See Disclaimer for more information.
Cryptocurrency charts by TradingView.