The recent listing announcement of the XRP token into the Coinbase Pro platform has created some strong whipsaw moves in the market. Besides, it can assist in the never-ending argument whether or not XRP is a security token. Price action has increased by over 5%, at the time of writing, getting the current XRP price up to $0.328.
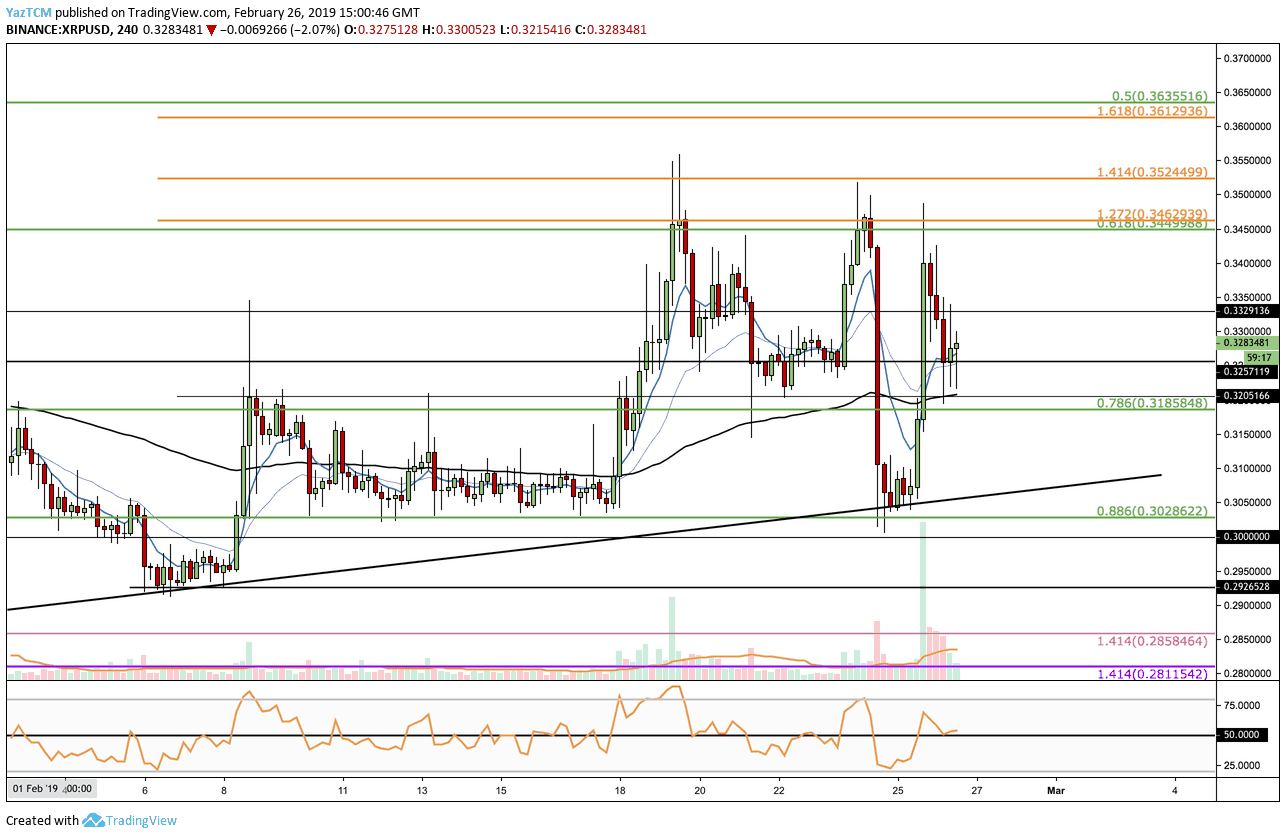
Looking at the XRP/USD 4HR Chart:
- Much has developed since our last Ripple analysis: Price action had found resistance once again at the $0.345 level as the sharp drop in Bitcoin led XRP/USD to tumble into support at the .886 Fibonacci Retracement level at $0.30 (marked in green).
- The announcement by Coinbase had had an immediate effect, causing the price to soar by a total of 14% into resistance at the $0.345 mark (for the second time in the past days). The market has since declined slightly and is now traded above the $0.325 support level.
- From above: The nearest resistance lies at the $0.3329 and $0.345 levels. If the bulls can continue higher, the further resistance level is expected at the 1.414 ($0.3524) and 1.618 ($0.3612) Fibonacci Extension levels (marked in orange).
- From below: If the sellers break below the $0.345 support level, further support is located at the $0.32 level followed by $0.3185 .786 Fibonacci Retracement level (marked in green).
- Further support beneath $0.31 lies at the ascending trend-line, before reaching the $0.30 mark.
- The volume has surged following the Coinbase announcement.
- The 4-hour RSI is currently above the 50 levels to indicate that the bulls are still in control of the momentum.
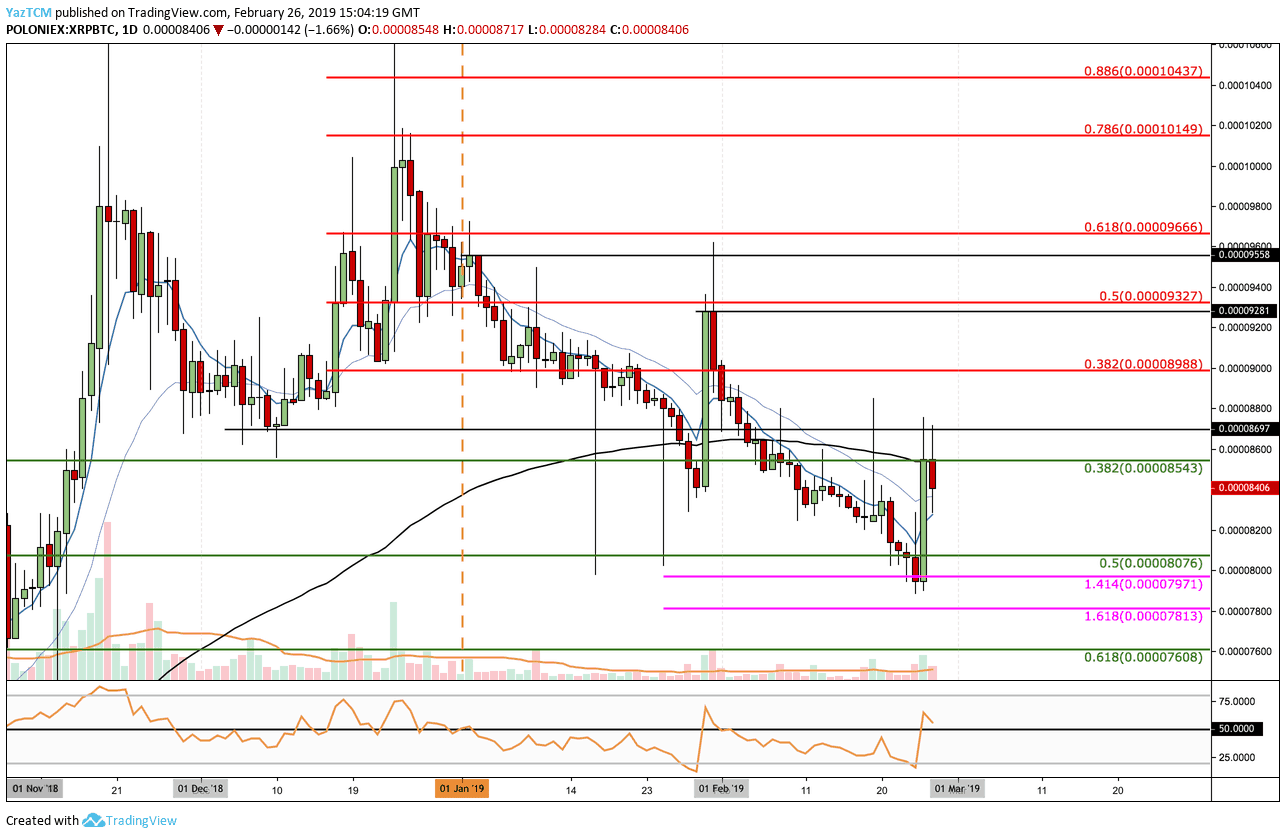
Looking at the XRP/BTC 1-Day Chart:
- Since our previous analysis, the XRP-BTC market had continued to decline even lower into our mentioned support level at the short term downside 1.414 Fibonacci Extension level located at 7971 SAT (marked in pink).
- The Coinbase announcement had caused XRP/BTC to surge up to the 8543 SAT resistance level, located at the .382 Fibonacci Retracement level (marked in green).
- From above: The nearest resistance above 8543 SAT lies at 8700 SAT. Further resistance lies at the short term bearish .382 (8990 SAT) and .5 (9330 SAT) Fibonacci Retracement levels (marked in red).
- From below: The nearest support lies at 8200 SAT. Support beneath lies around the 8000 SAT .5 Fibonacci Retracement level (marked in green).
- If the sell-off continues beneath 8000 SAT, further support is expected at the downside 1.414 (7970 SAT) and 1.618 (7810 SAT) Fibonacci Extension levels (marked in pink).
- The 4-hour RSI is in the bullish territory above 50.
- The volume has increased slightly over the past two trading
SPECIAL OFFER (Sponsored)
Binance Free $600 (CryptoPotato Exclusive): Use this link to register new account and receive $600 exclusive welcome offer on Binance (
full details).
LIMITED OFFER 2024 for CryptoPotato readers at Bybit: Use this link to register and open a $500 BTC-USDT position on Bybit Exchange for free!
Disclaimer: Information found on CryptoPotato is those of writers quoted. It does not represent the opinions of CryptoPotato on whether to buy, sell, or hold any investments. You are advised to conduct your own research before making any investment decisions. Use provided information at your own risk. See Disclaimer for more information.
Cryptocurrency charts by TradingView.