Ripple has seen a small price decrease over the previous week, down to around $0.30, at the time of writing. The market has now lost a further 7.5% over the past month as XRP/USD trades within a symmetrical triangle pattern.
After losing the second place, Ripple is currently ranked as the third largest crypto as it holds a $12.45 billion market cap value.
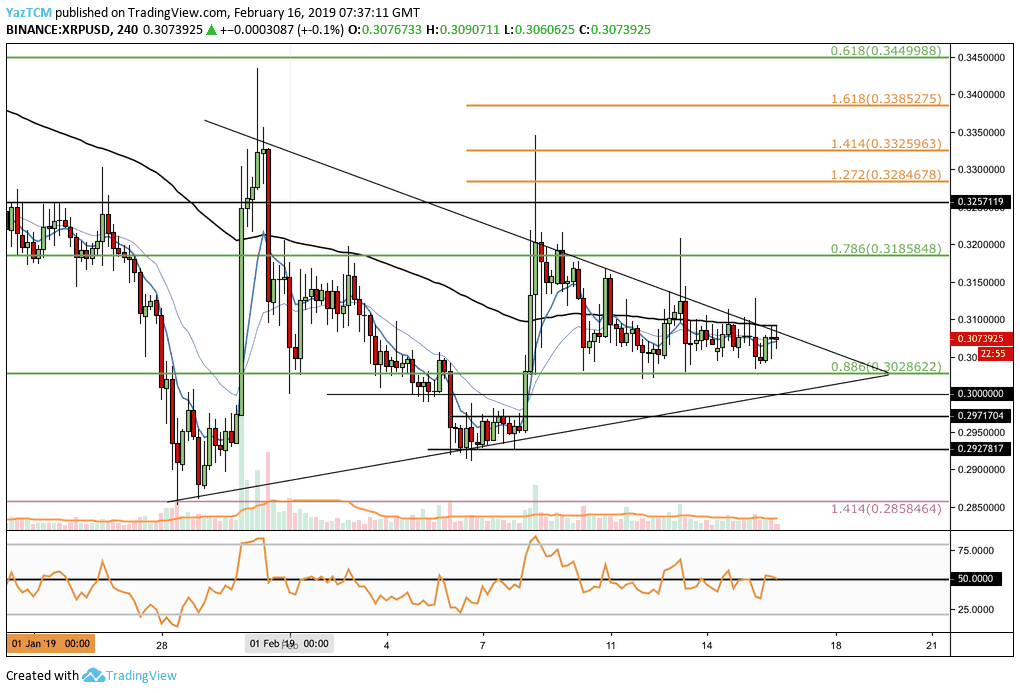
Looking at the XRP/USD 4-hour Chart
- We can see that XRP/USD is trapped within the symmetrical triangle, as mentioned, while the coin trades in a consolidation, following Bitcoin.
- A break above or below the triangle will determine the next direction for XRP’s short-term future.
- From Below: The nearest support is located at the short term .886 Fibonacci Retracement level (marked in green) at $0.30, followed by support at the lower boundary of the triangle.
- Support beneath the triangle is located at $0.2971 and $0.2927. This is followed with support at the medium term downside 1.414 Fibonacci Extension level (marked in lilac) priced at $0.2858. This level is the 2018 and 2019 price low for XRP.
- From Above; initial resistance is the upper boundary of the triangle, followed by resistance level at the short term .786 Fibonacci Retracement (marked in green).
- Further resistance lies at $0.3257, followed by resistance at the short term 1.272 ($0.3284), 1.414 ($0.3325) and 1.618 ($0.3385) Fibonacci Extension levels (marked in orange).
- The 4-hour chart’s RSI indicator remains around the 50 level which indicates the indecision of the XRP market.
- The volume remains steady and not significant.
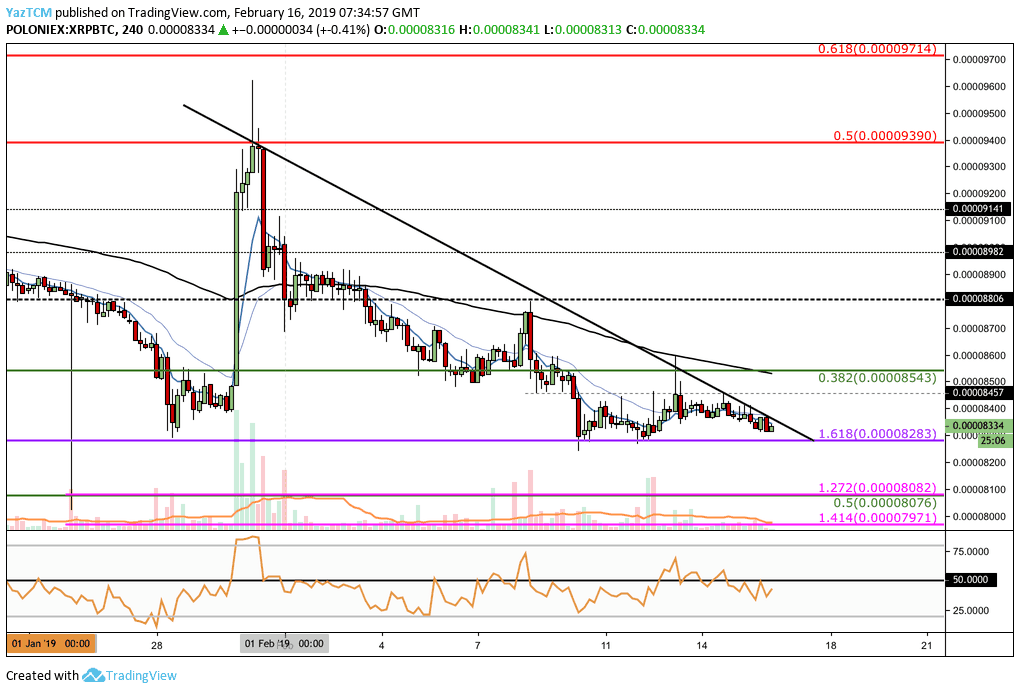
Looking at the XRP/BTC 1-Day Chart
- XRP/BTC has also formed a descending triangle pattern as the market consolidates.
- Price action is approaching the end of the pattern where a breakout is expected either to the upside or downside to determine the next short-term trend.
- From below: The nearest support is located at the lower boundary of the triangle at the 8283 SAT level.
- Support beneath can then be found at 8200 SAT followed by more significant support at the short term downside 1.272 (8000 – 8082 SAT) and 1.414 (7971 SAT) Fibonacci Extension levels (marked in pink).
- From above: The nearest resistance lies at the upper boundary of the triangle. This is followed with resistance at the 8457 SAT level and the short-term .382 Fibonacci retracement level (marked in green) at 8543 SAT.
- Further significant resistance is then expected at 8806 SAT, 8982 SAT, and 9141 SAT.
- The 4-hour chart’s RSI has slipped below the 50 area which indicates that the bears have the momentum of the XRP-BTC market. However, the RSI is battling back toward the 50 levels.
- The volume remains steady.
SPECIAL OFFER (Sponsored)
LIMITED OFFER 2024 for CryptoPotato readers at Bybit: Use this link to register and open a $500 BTC-USDT position on Bybit Exchange for free!
Disclaimer: Information found on CryptoPotato is those of writers quoted. It does not represent the opinions of CryptoPotato on whether to buy, sell, or hold any investments. You are advised to conduct your own research before making any investment decisions. Use provided information at your own risk. See Disclaimer for more information.
Cryptocurrency charts by TradingView.