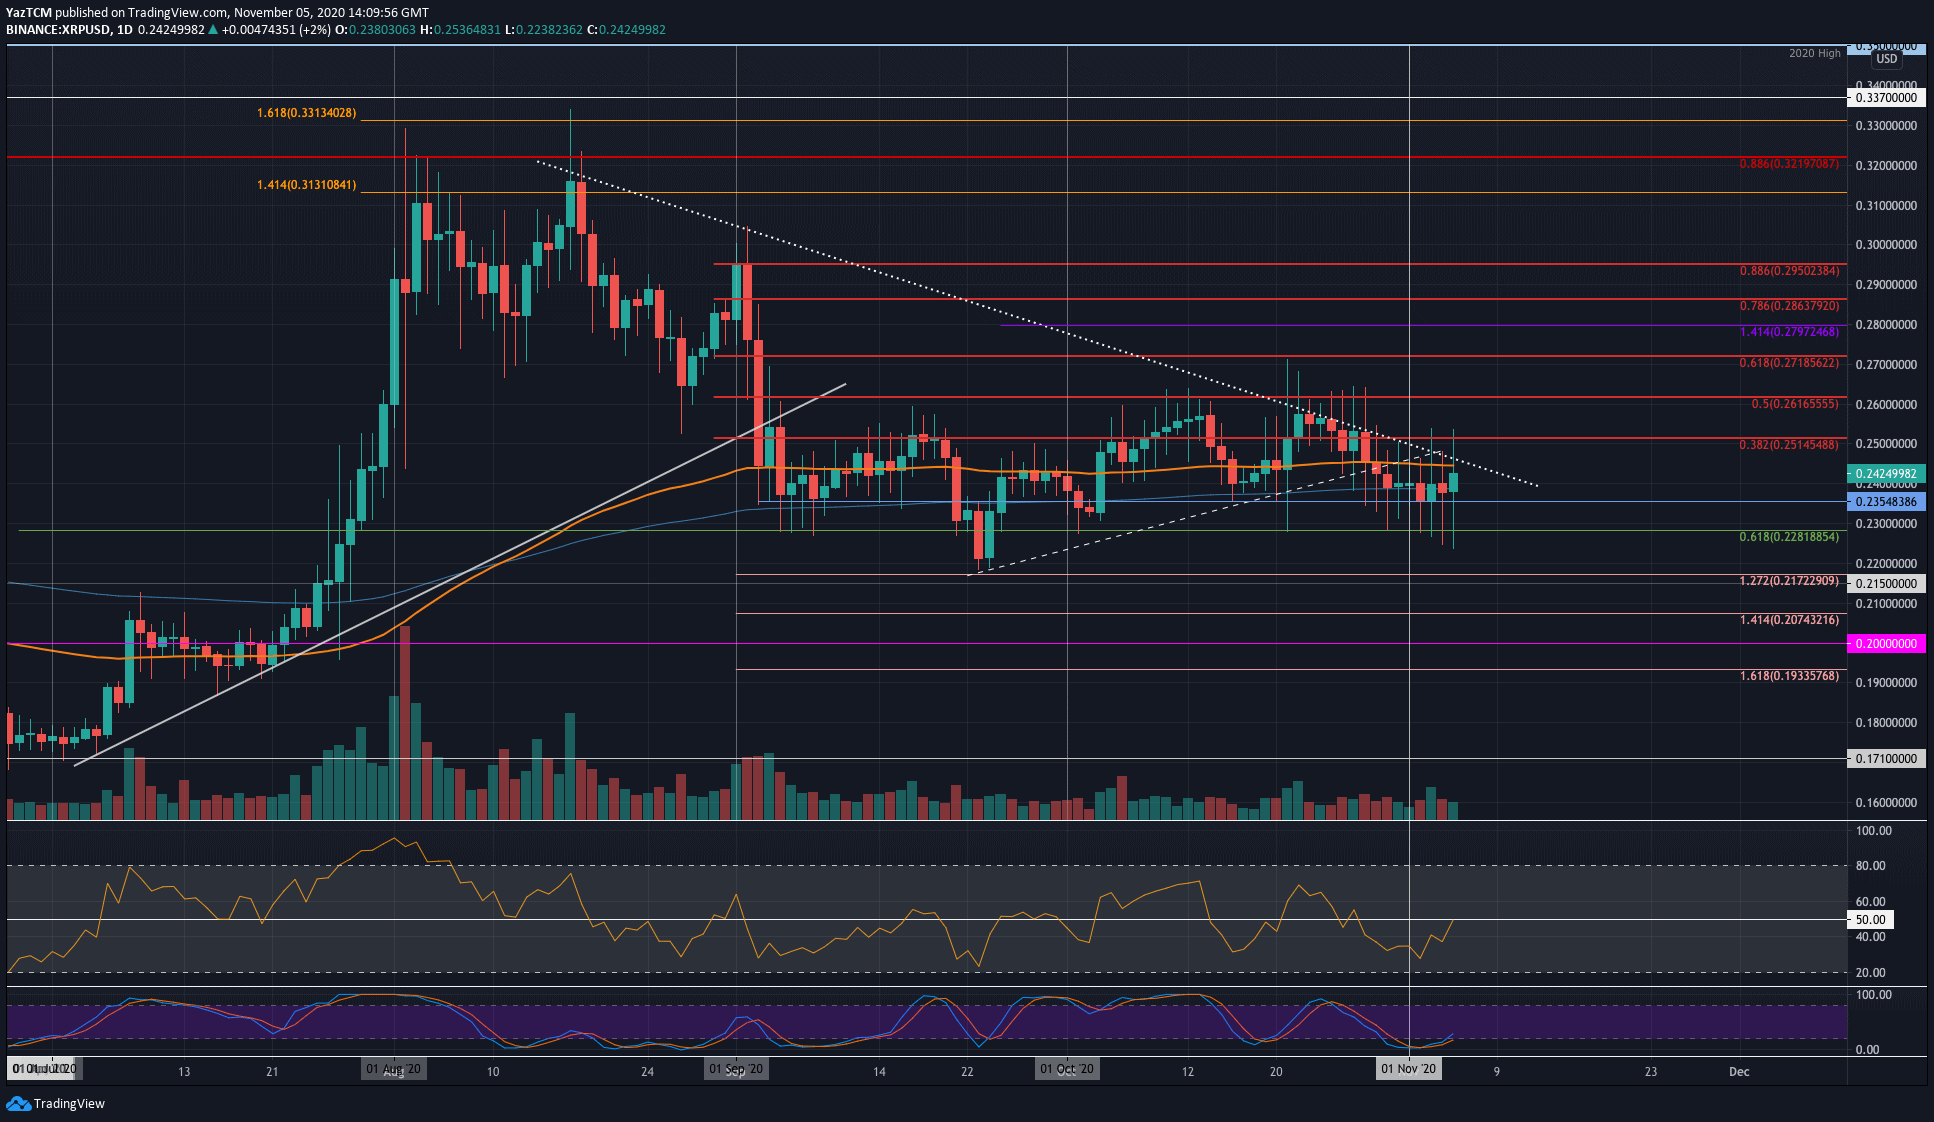
XRP/USD Daily Chart. Source: TradingView
Key Support Levels: $0.24, $235, $0.228.
Key Resistance Levels: $0.251, $0.261, $0.271.
XRP fell lower from resistance at a falling trend line toward the end of October. It initially found support at the 200-days EMA at $0.24 but broke beneath it in November. After that, XRP continued to drop into the support at $0.235 and held here over the past few days.
The coin has since rebounded and it pushed higher today but is facing resistance at the 100-days EMA, which is further bolstered by a falling trend line.
Moving forward, the bulls can break the 100-days EMA and push above the falling trend line; the first level of resistance is expected at $0.251 (bearish .382 Fib). Above this, resistance lies at $0.261 (bearish .5 Fib) and $0.271 (bearish .618 Fib).
On the other side, the first level of support lies at $0.24 (200-days EMA). Beneath this, support is found at $0.235 and $0.228 (.618 Fib Retracement).
The Stochastic RSI is producing a bullish crossover signal in oversold territory, which is a promising signal for buyers. Additionally, the RSI is at the mid-line, suggesting that the buyers attempt to regain control of the market momentum.
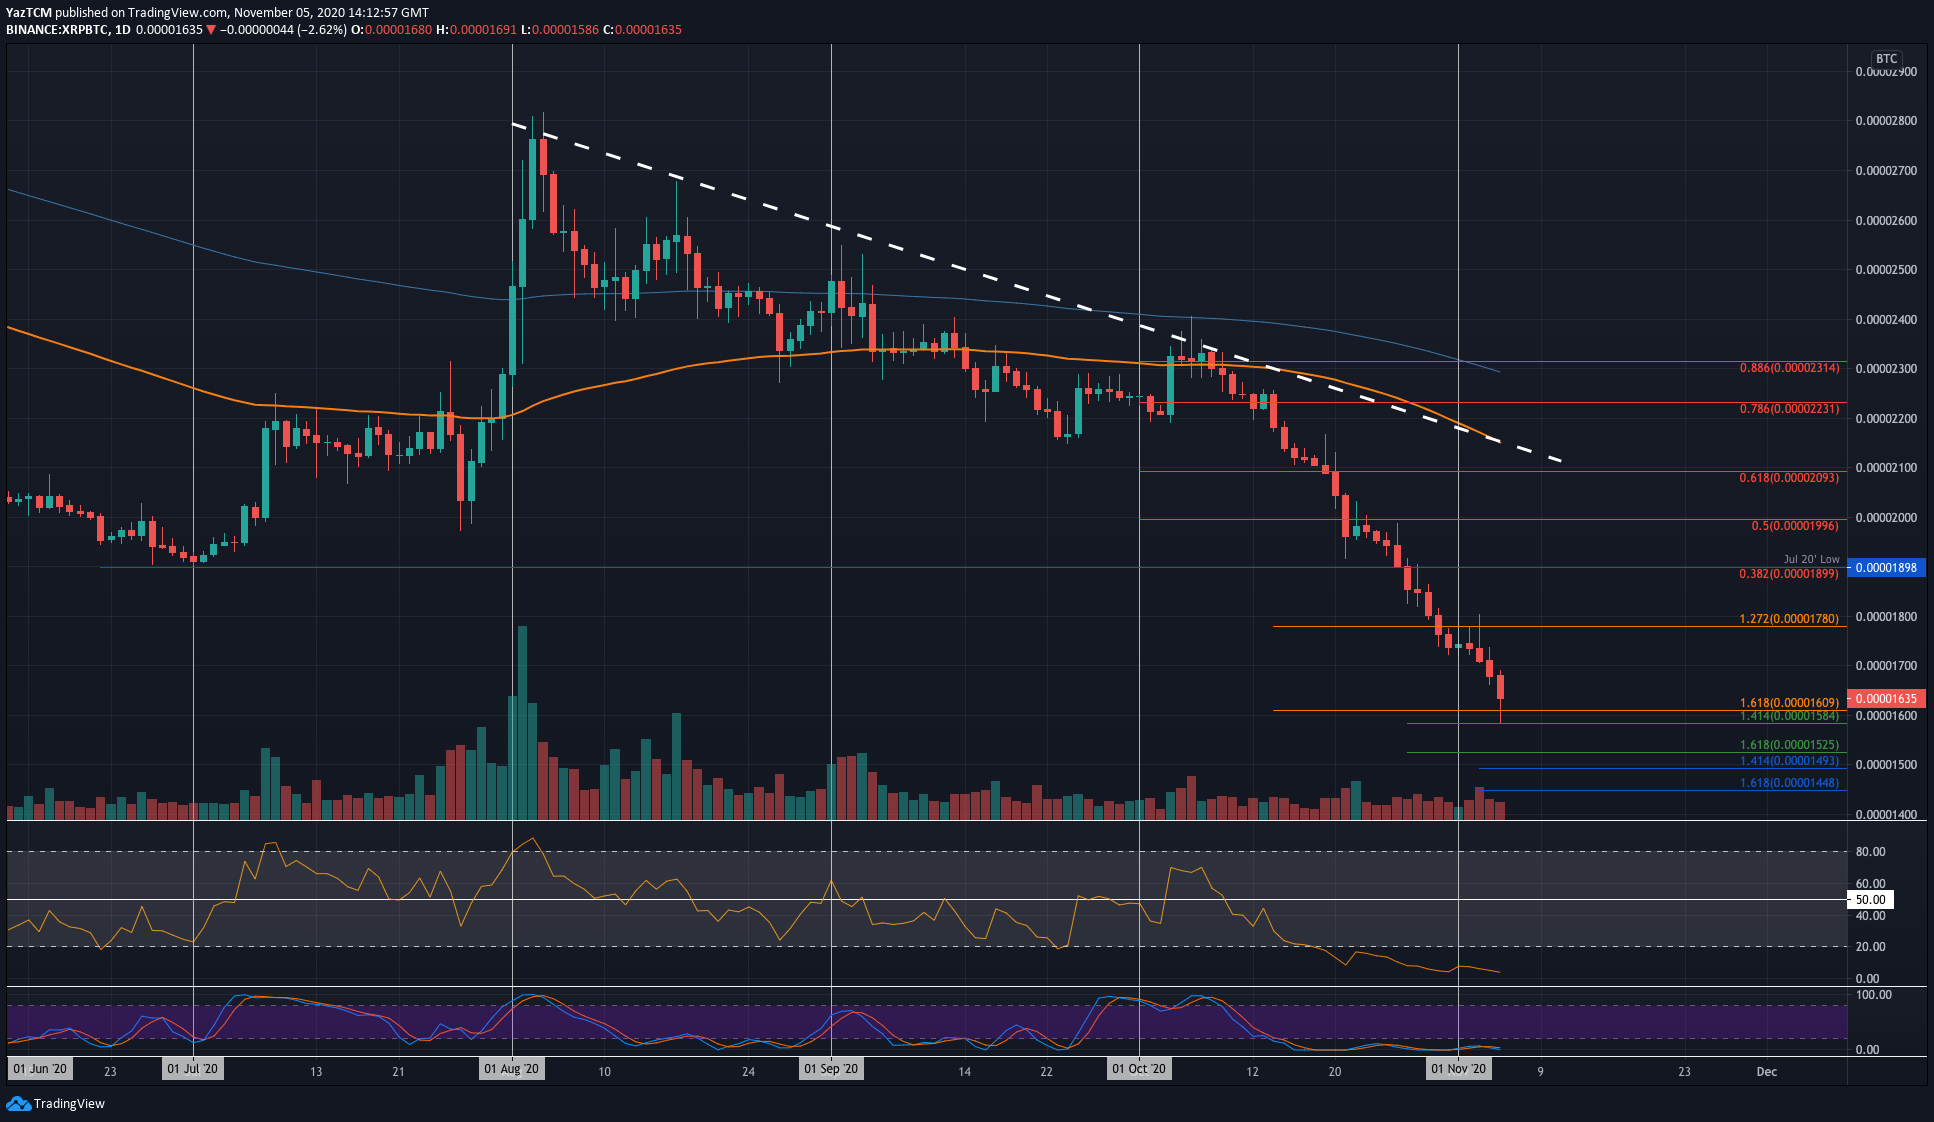
Key Support Levels: 1610 SAT, 15854 SAT, 1525 SAT.
Key Resistance Levels: 1700 SAT, 1780 SAT, 1900 SAT.
XRP continued to head lower against Bitcoin as it spiked beneath 1600 SAT today for the first time since December 11th, 2017. Since the start of October, the coin has suffered significantly after it dropped below the 2400 SAT resistance.
By the looks of things, it seems that XRP might be headed back toward the December 2017 lows at around 1200 SAT if the buyers do not regroup anytime soon.
Looking ahead, if the sellers head lower again, the first level of support lies at 1610 SAT. Beneath this, support lies at 1585 SAT (downside 1.414 Fib Extension), 1525 SAT 0downside 1.618 Fib Extension), and 1493 SAT.
Alternatively, if the bulls can rebound, resistance lies at 1700 SAT, 1780 SAT, and 1900 SAT (July 20’ lows).
Both the RSI and Stochastic RSI are incredibly oversold and have been since mid-October. This suggests that the sellers might be a little overextended.