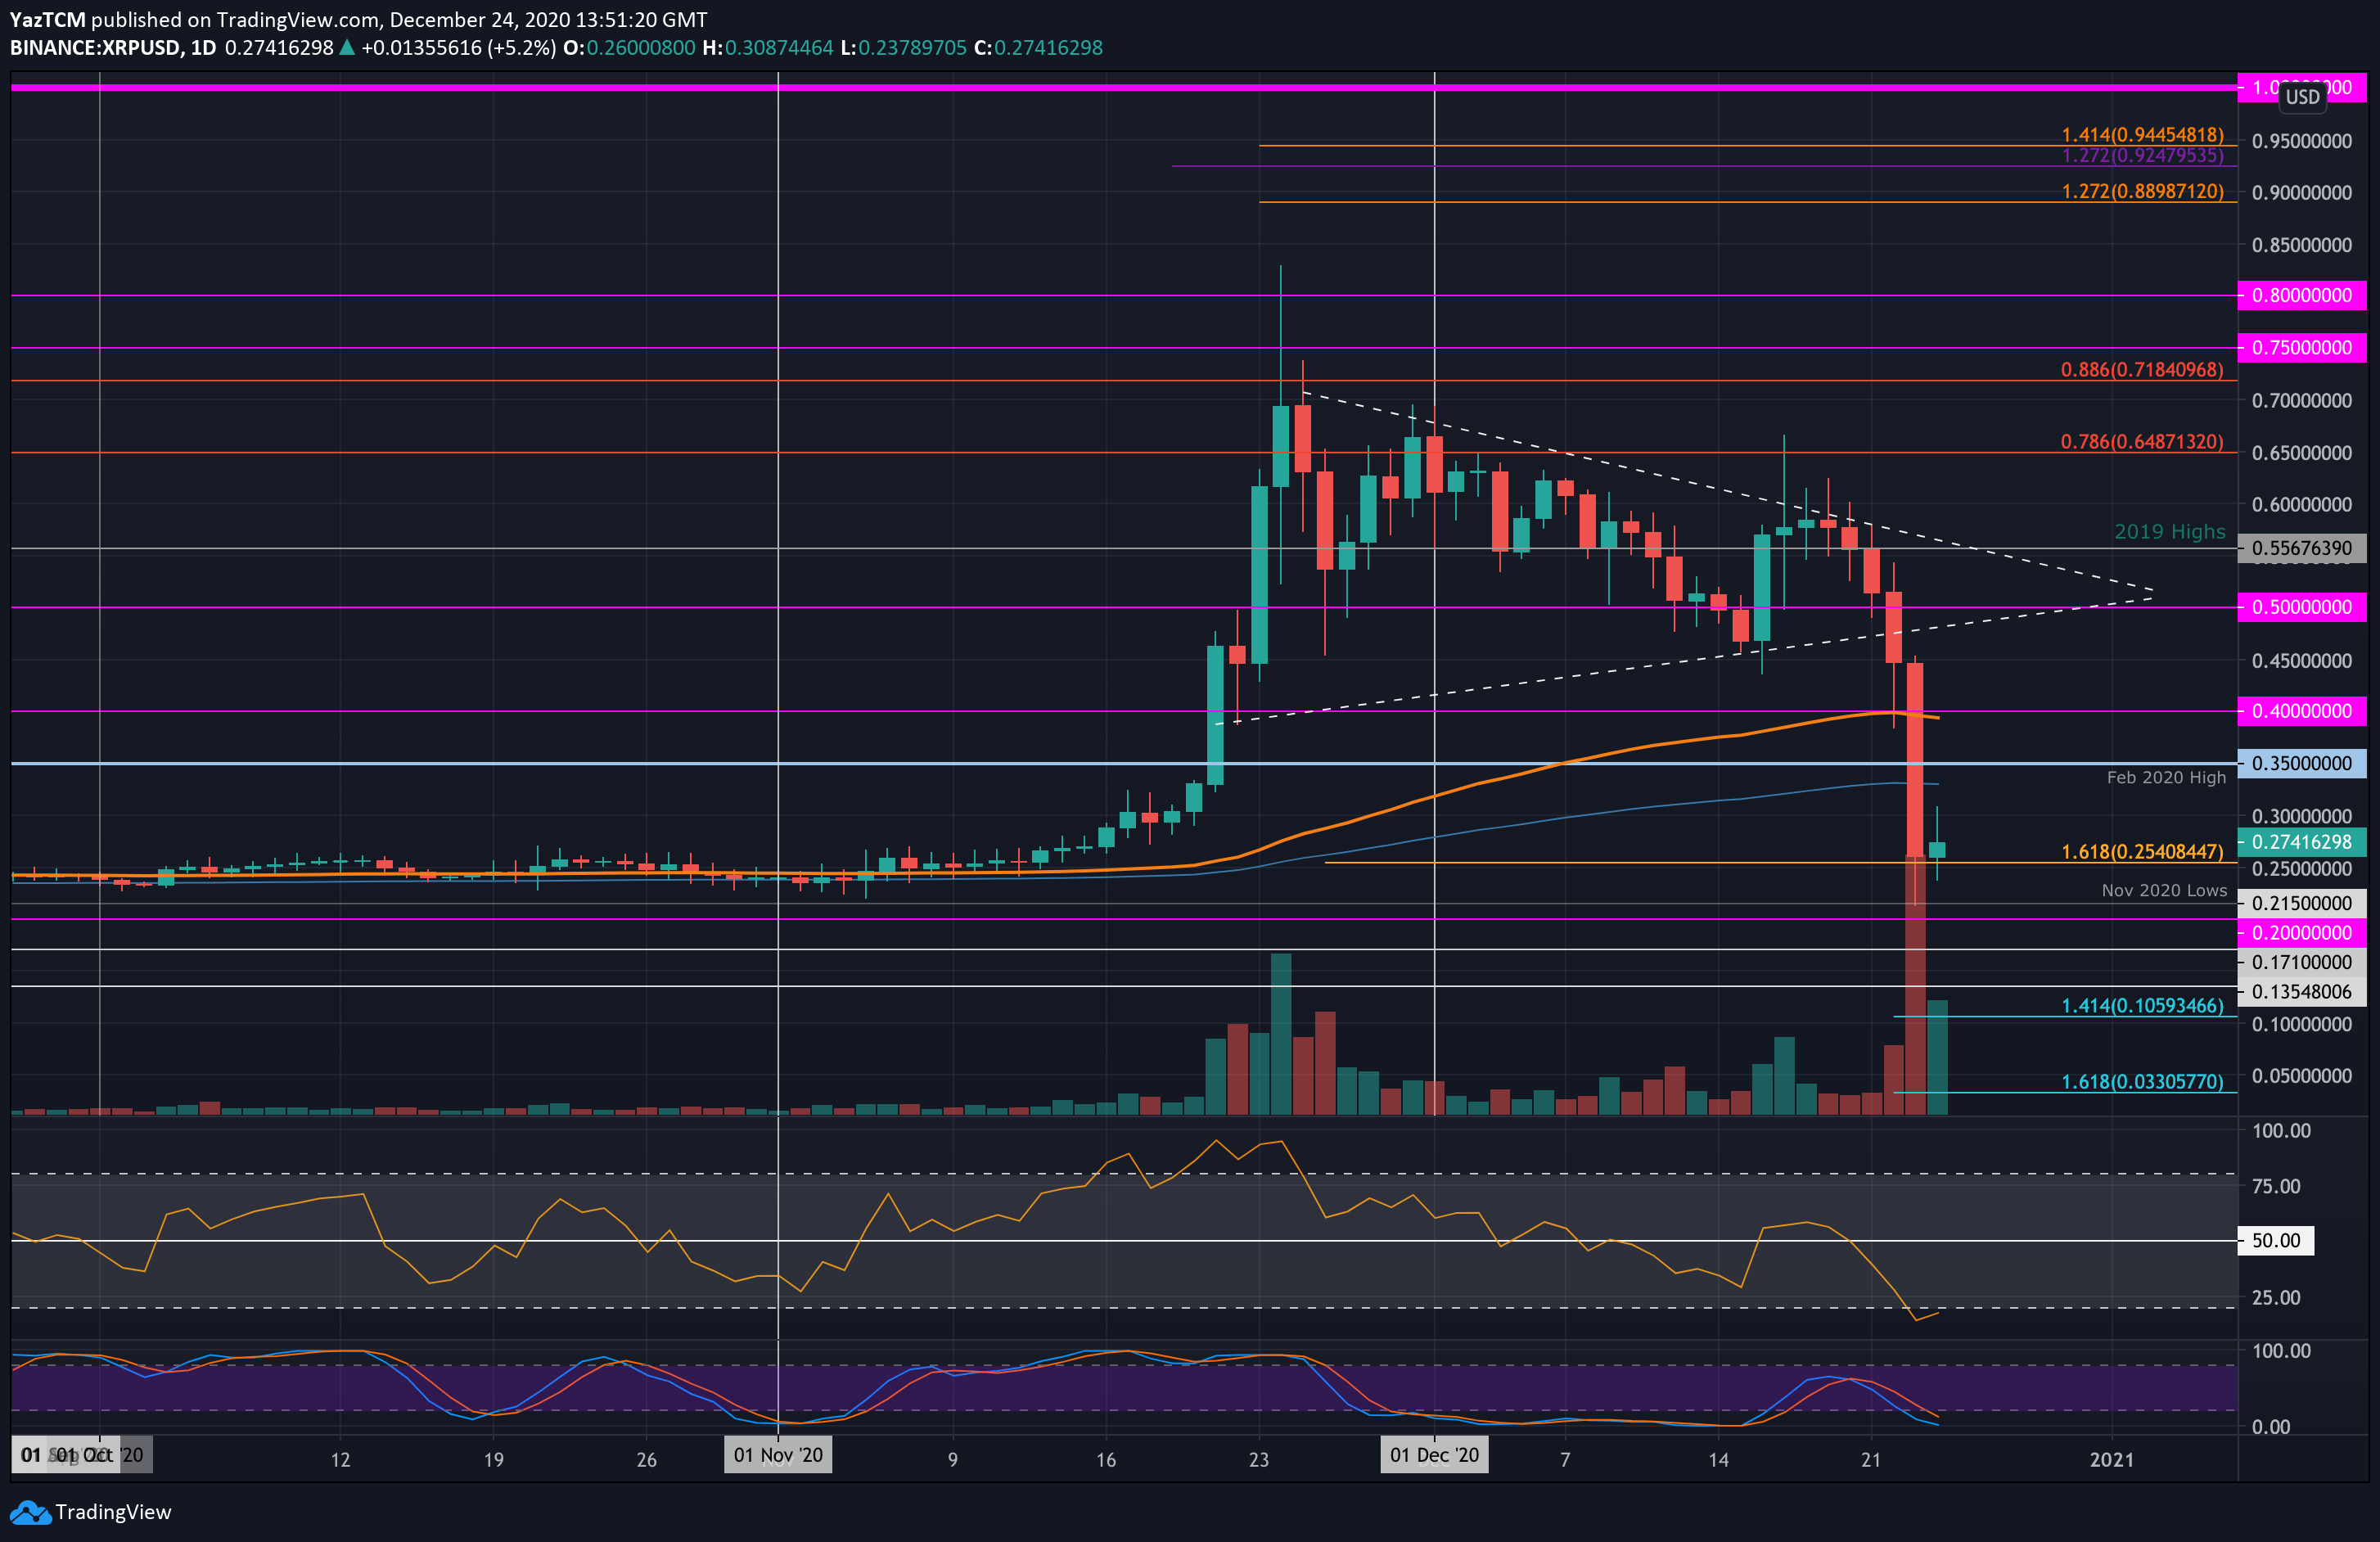
XRP/USD Daily Chart. Source: TradingView
Key Support Levels: $0.3, $0.286, $0.25.
Key Resistance Levels:$0.35, $0.4, $0.435.
Yesterday, XRP suffered a disastrous 52% on the news that the company was being sued by the SEC. The coin dropped beneath $0.5 on Tuesday and went on to break beneath $0.4 yesterday to spike as low as $0.215, where it found support at the November 2020 lows.
Luckily, the buyers bounced higher from the November 2020 lows to close the daily candle at the $0.255 level. XRP has since pushed slightly higher to trade at the current $0.274 level. Still, XRP is down about 60% in the past seven days.
Looking ahead, if the first level of support lies at $0.255. This is followed by $0.25, $0.215 (November 2020 lows), $0.2, and $0.171 (July 2020 lows).
On the other side, the first level of resistance lies at $0.3. This is followed by $0.34 (200-days EMA), $0.35 (Feb 2020 Highs), and $0.4 (100-days EMA).
The RSI has bounced from extremely oversold conditions, but the bears control the market momentum entirely right now.
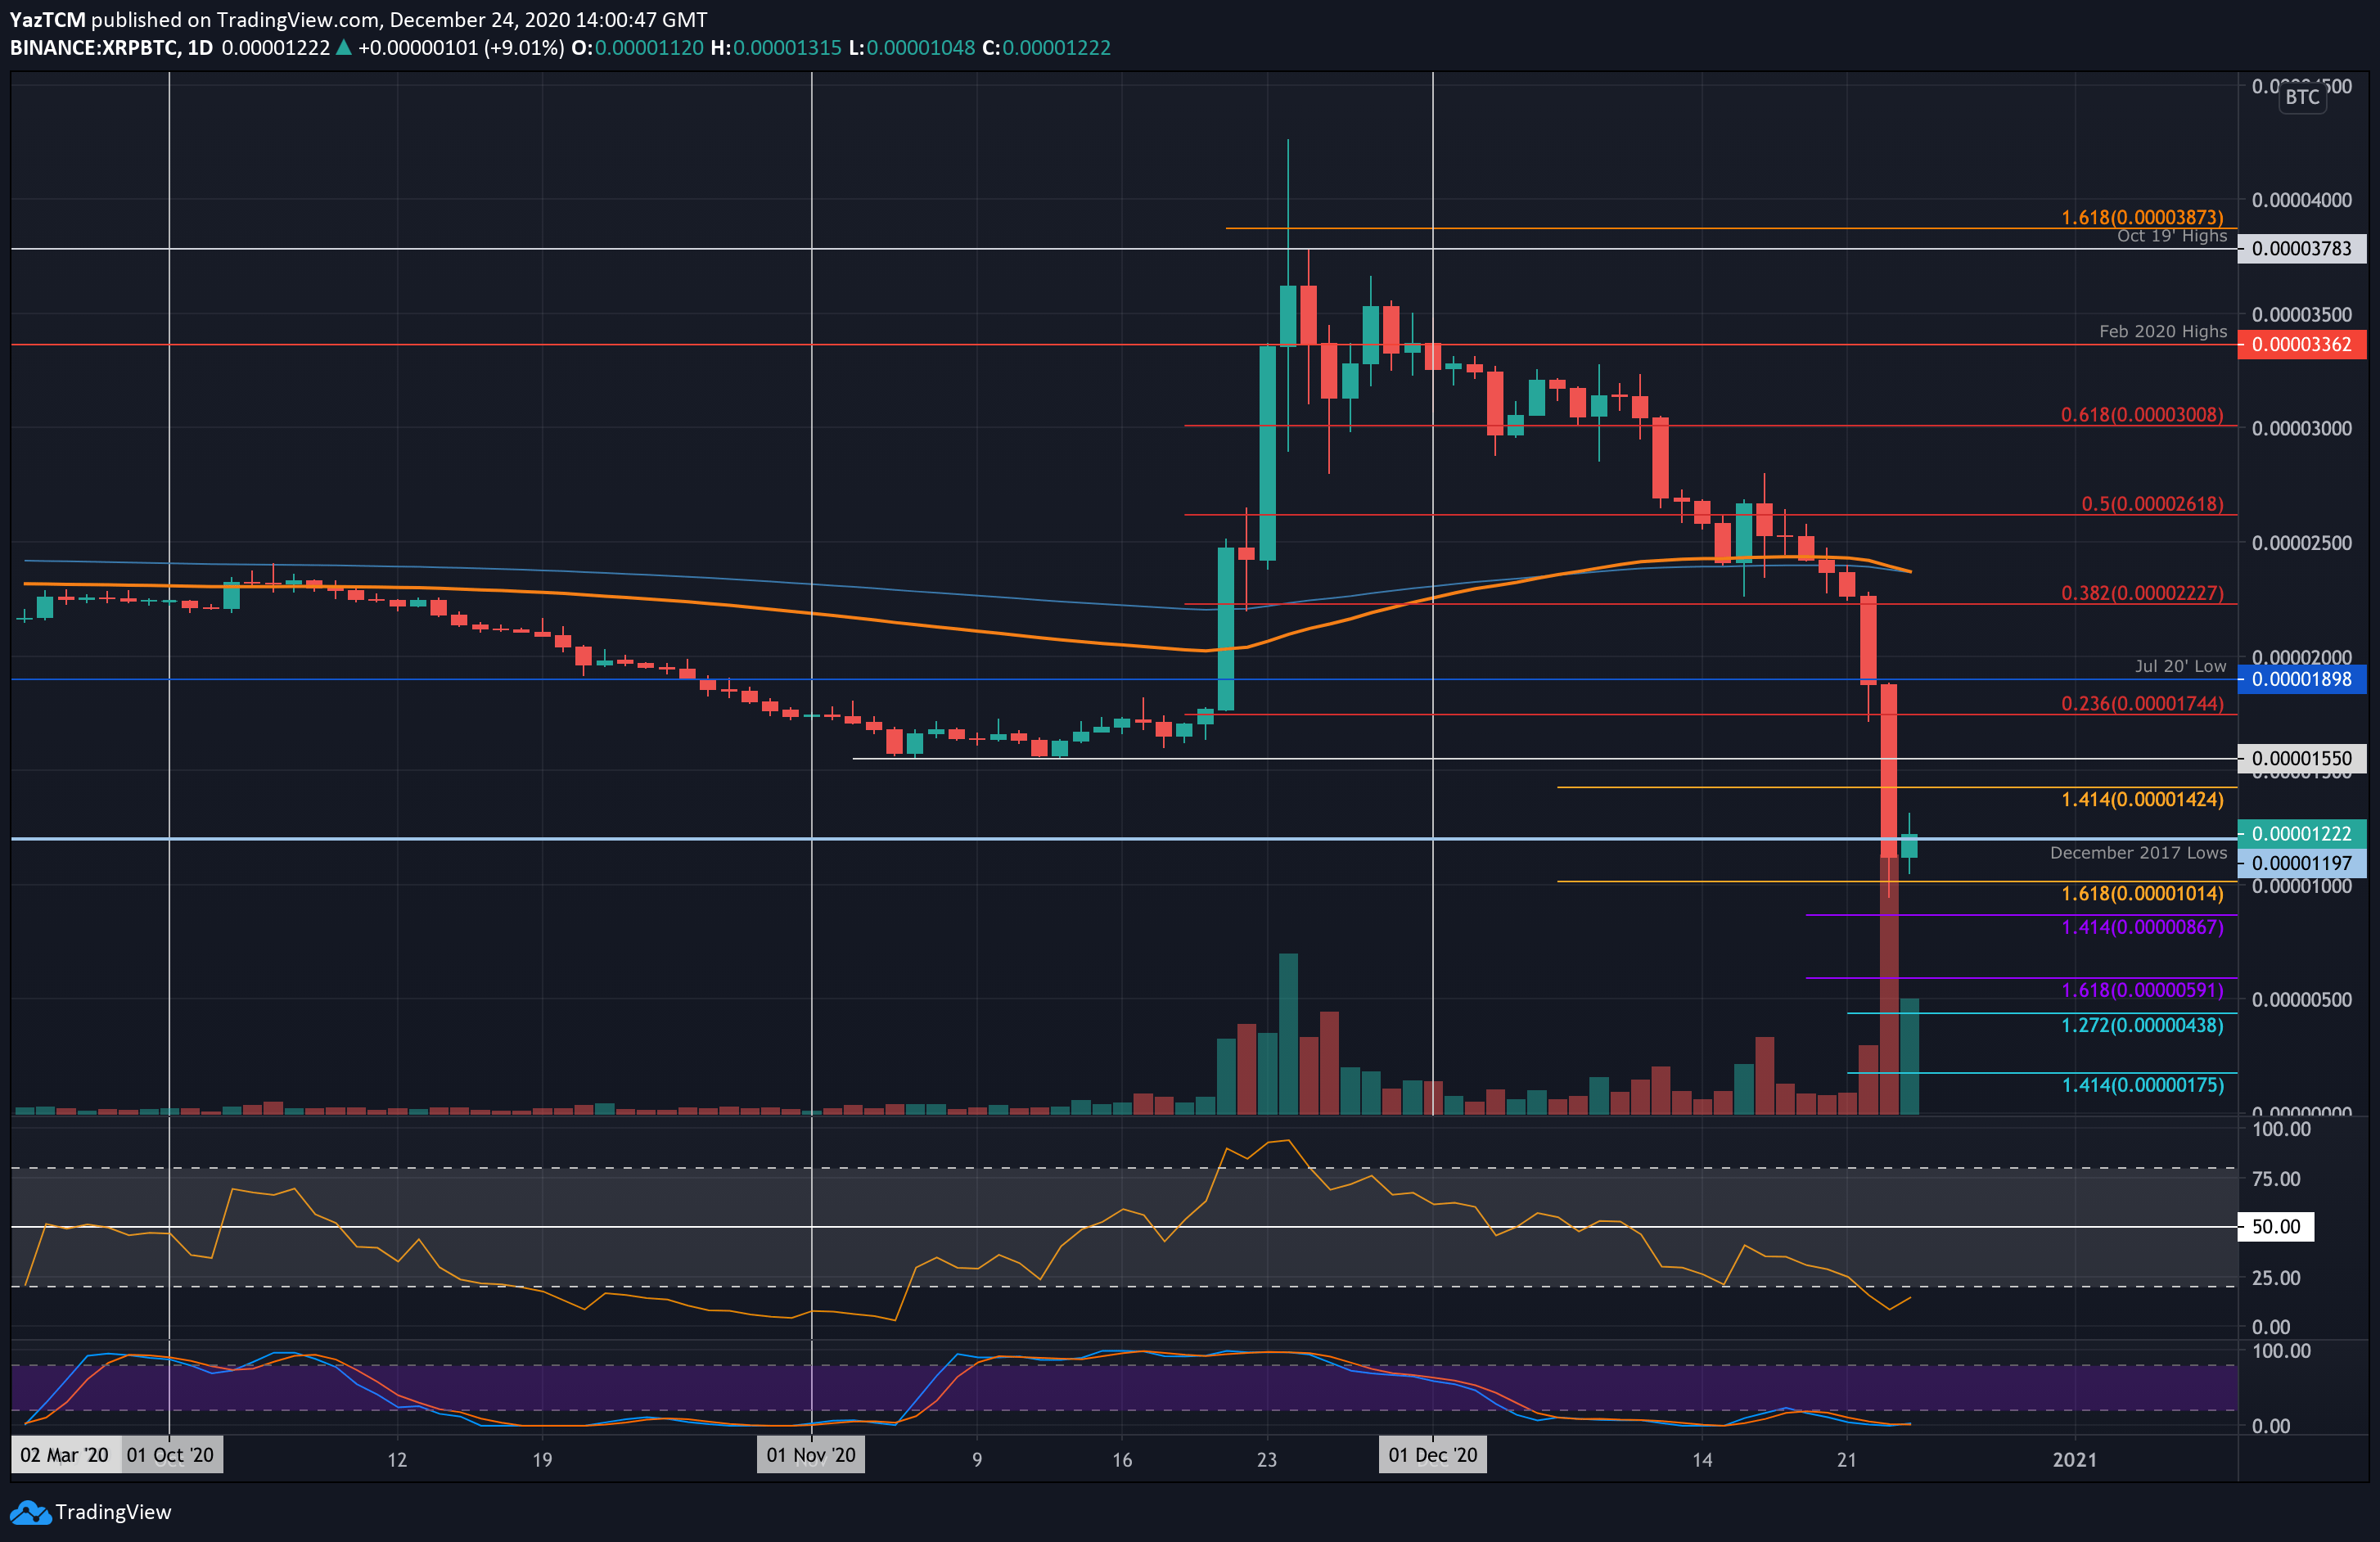
Key Support Levels: 1100 SAT, 1015 SAT, 900 SAT.
Key Resistance Levels: 1550 SAT, 1745 SAT, 2000 SAT.
Against Bitcoin, XRP fell into 3-year lows yesterday and went on to break beneath the December 2017 lows at 1200 SAT. It continued to drop and spiked as low as 945 SAT before rebounding to close the daily candle at around 1120 SAT.
Today, XRP bounced slightly higher and is in a battle to reclaim the December 2020 lows as it trades at 1222 SAT at the time of writing.
Looking ahead, the first level of resistance lies at 15550 SAT (November 2020 lows). This is followed by 1745 SAT (bearish .236 Fib), 1900 SAT (July 2020 lows), and 2000 SAT.
On the other side, the first level of support lies at 1100 SAT. This is followed by 1015 SAT (downside 1.618 Fib), 900 SAT, 867 SAT, and 700 SAT.
Likewise, the RSI rebounded from oversold conditions, and the Stochastic RSI is priming itself for a bullish crossover signal that should, hopefully, bring XRP above the 3-year low prices again.