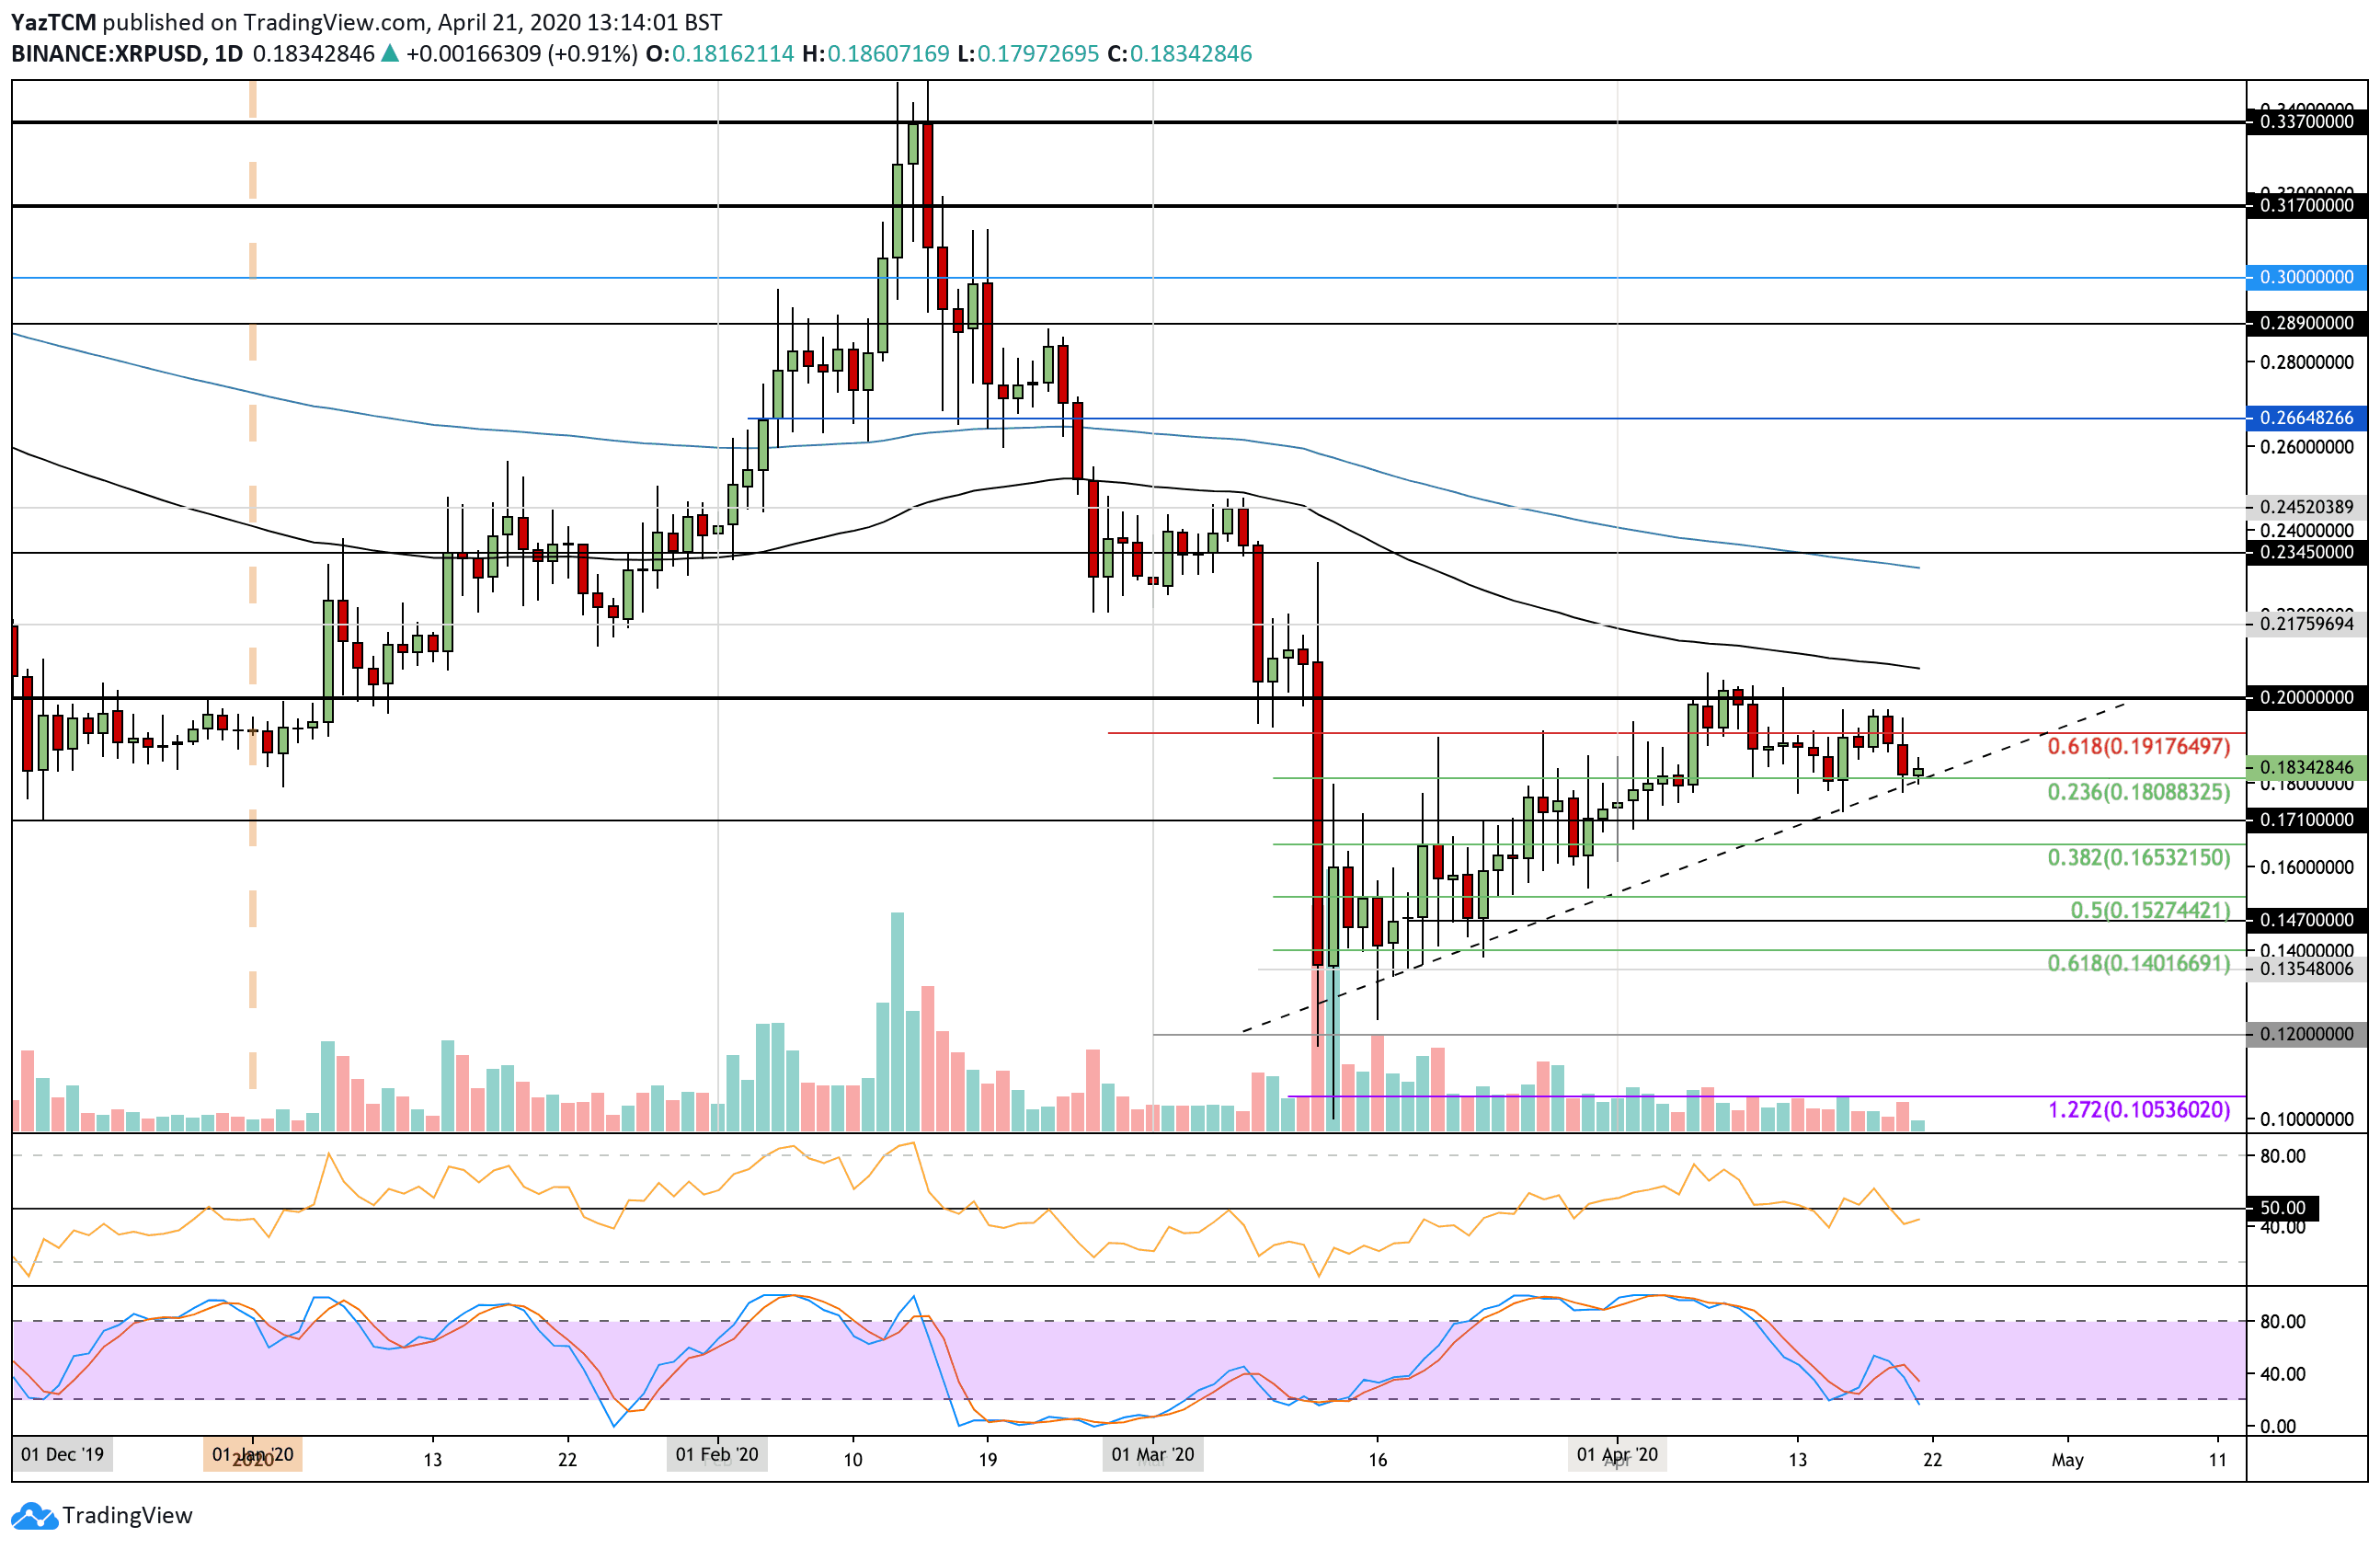
XRP/USD:
Support: $0.18, $0.171, $0.165.
Resistance: $0.191, $0.2, $0.208.
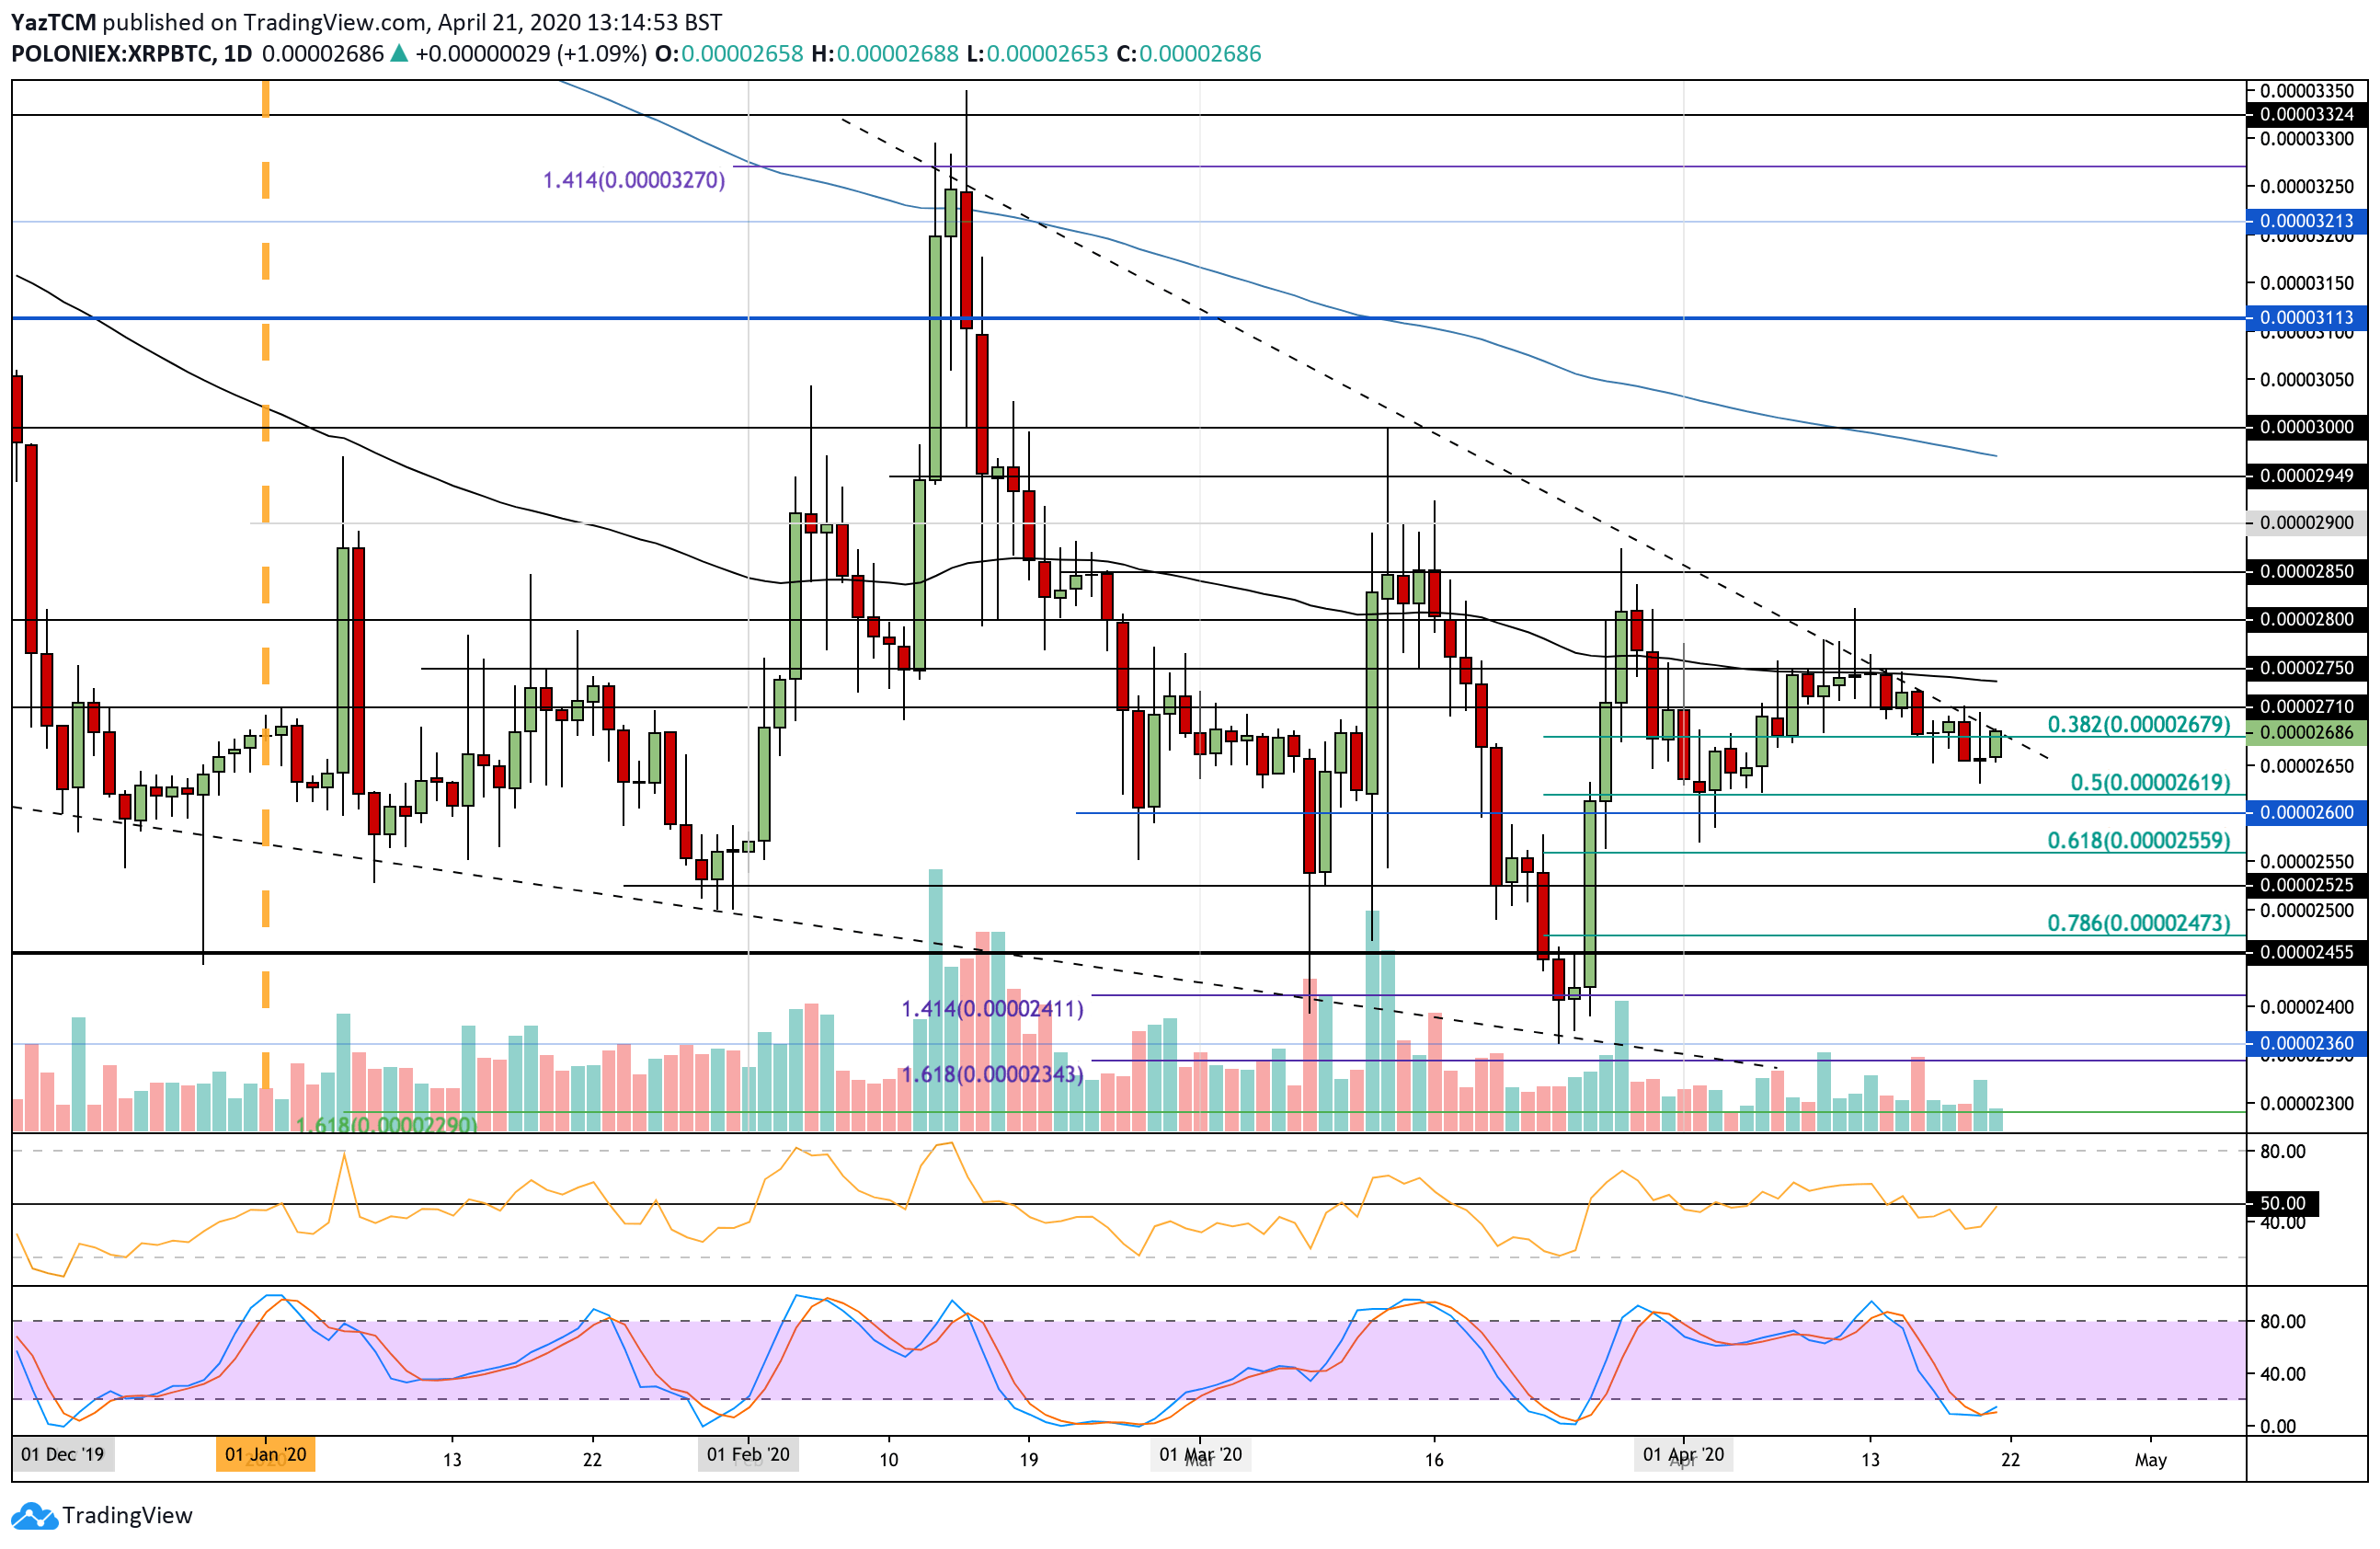
XRP/BTC:
Support: 2650 SAT, 2600 SAT, 2560 SAT.
Resistance: 2710 SAT, 2750 SAT, 2800 SAT.
XRP failed to reach as high as $0.2 over the weekend as it fell short near the $0.196 level. From here, it dropped as it fell into the current support at $0.18, which is provided by a short term .236 Fib Retracement. This support is further bolstered by the rising trend line that it has remained above for over a month now.
This price drop is largely driven by the fact that Bitcoin fell beneath the $7,000 support again to reach the $6,800 level. If XRP was to drop beneath the rising support, we might see it unwind toward $0.16.
If the sellers break the support at the rising trend line, the next level of support lies at $0.171. Beneath this, added support is located at $0.165 (.382 Fib Retracement), $0.16, $0.152 (.5 Fib Retracement), and $14 (.618 Fib Retracement).
Alternatively, if the bulls can rebound at $0.18, the first level of resistance lies at $0.191. Above this, resistance is located at $0.20, $0.207 (100-day EMA), and $0.217.
The RSI has dipped beneath the 50 line to show the sellers are taking control of the market momentum. For XRP to rebound from $0.18, the RSI would need to rise back above the 50 line.
Against Bitcoin, XRP fell beneath the .382 Fib Retracement support but managed to rebound at the 2650 SAT level. It is now trading at 2690 SAT, where it faces resistance at a falling trend line.
This falling trend line has been in plays since mid-February and must be overcome to see XRP headed higher.
If the buyers can break the falling trend line, the first level of resistance lies at 2710 SAT. Above this, resistance is located at 2750 SAT (100-day EMA), 2800 SAT, and 2850 SAT.
Toward the downside, the first level of support lies at 2650 SAT. Beneath this, added support is found at 2620 SAT (.5 Fib Retracement), 2600 SAT, and 2560 SAT (.618 Fib Retracement).
The RSI is attempting to break back above the 50 line and, if it does, XRP should be expected to rise back toward 2800 SAT. Additionally, the Stochastic RSI is primed for a bullish crossover signal, which would help to increase the bullish pressure.