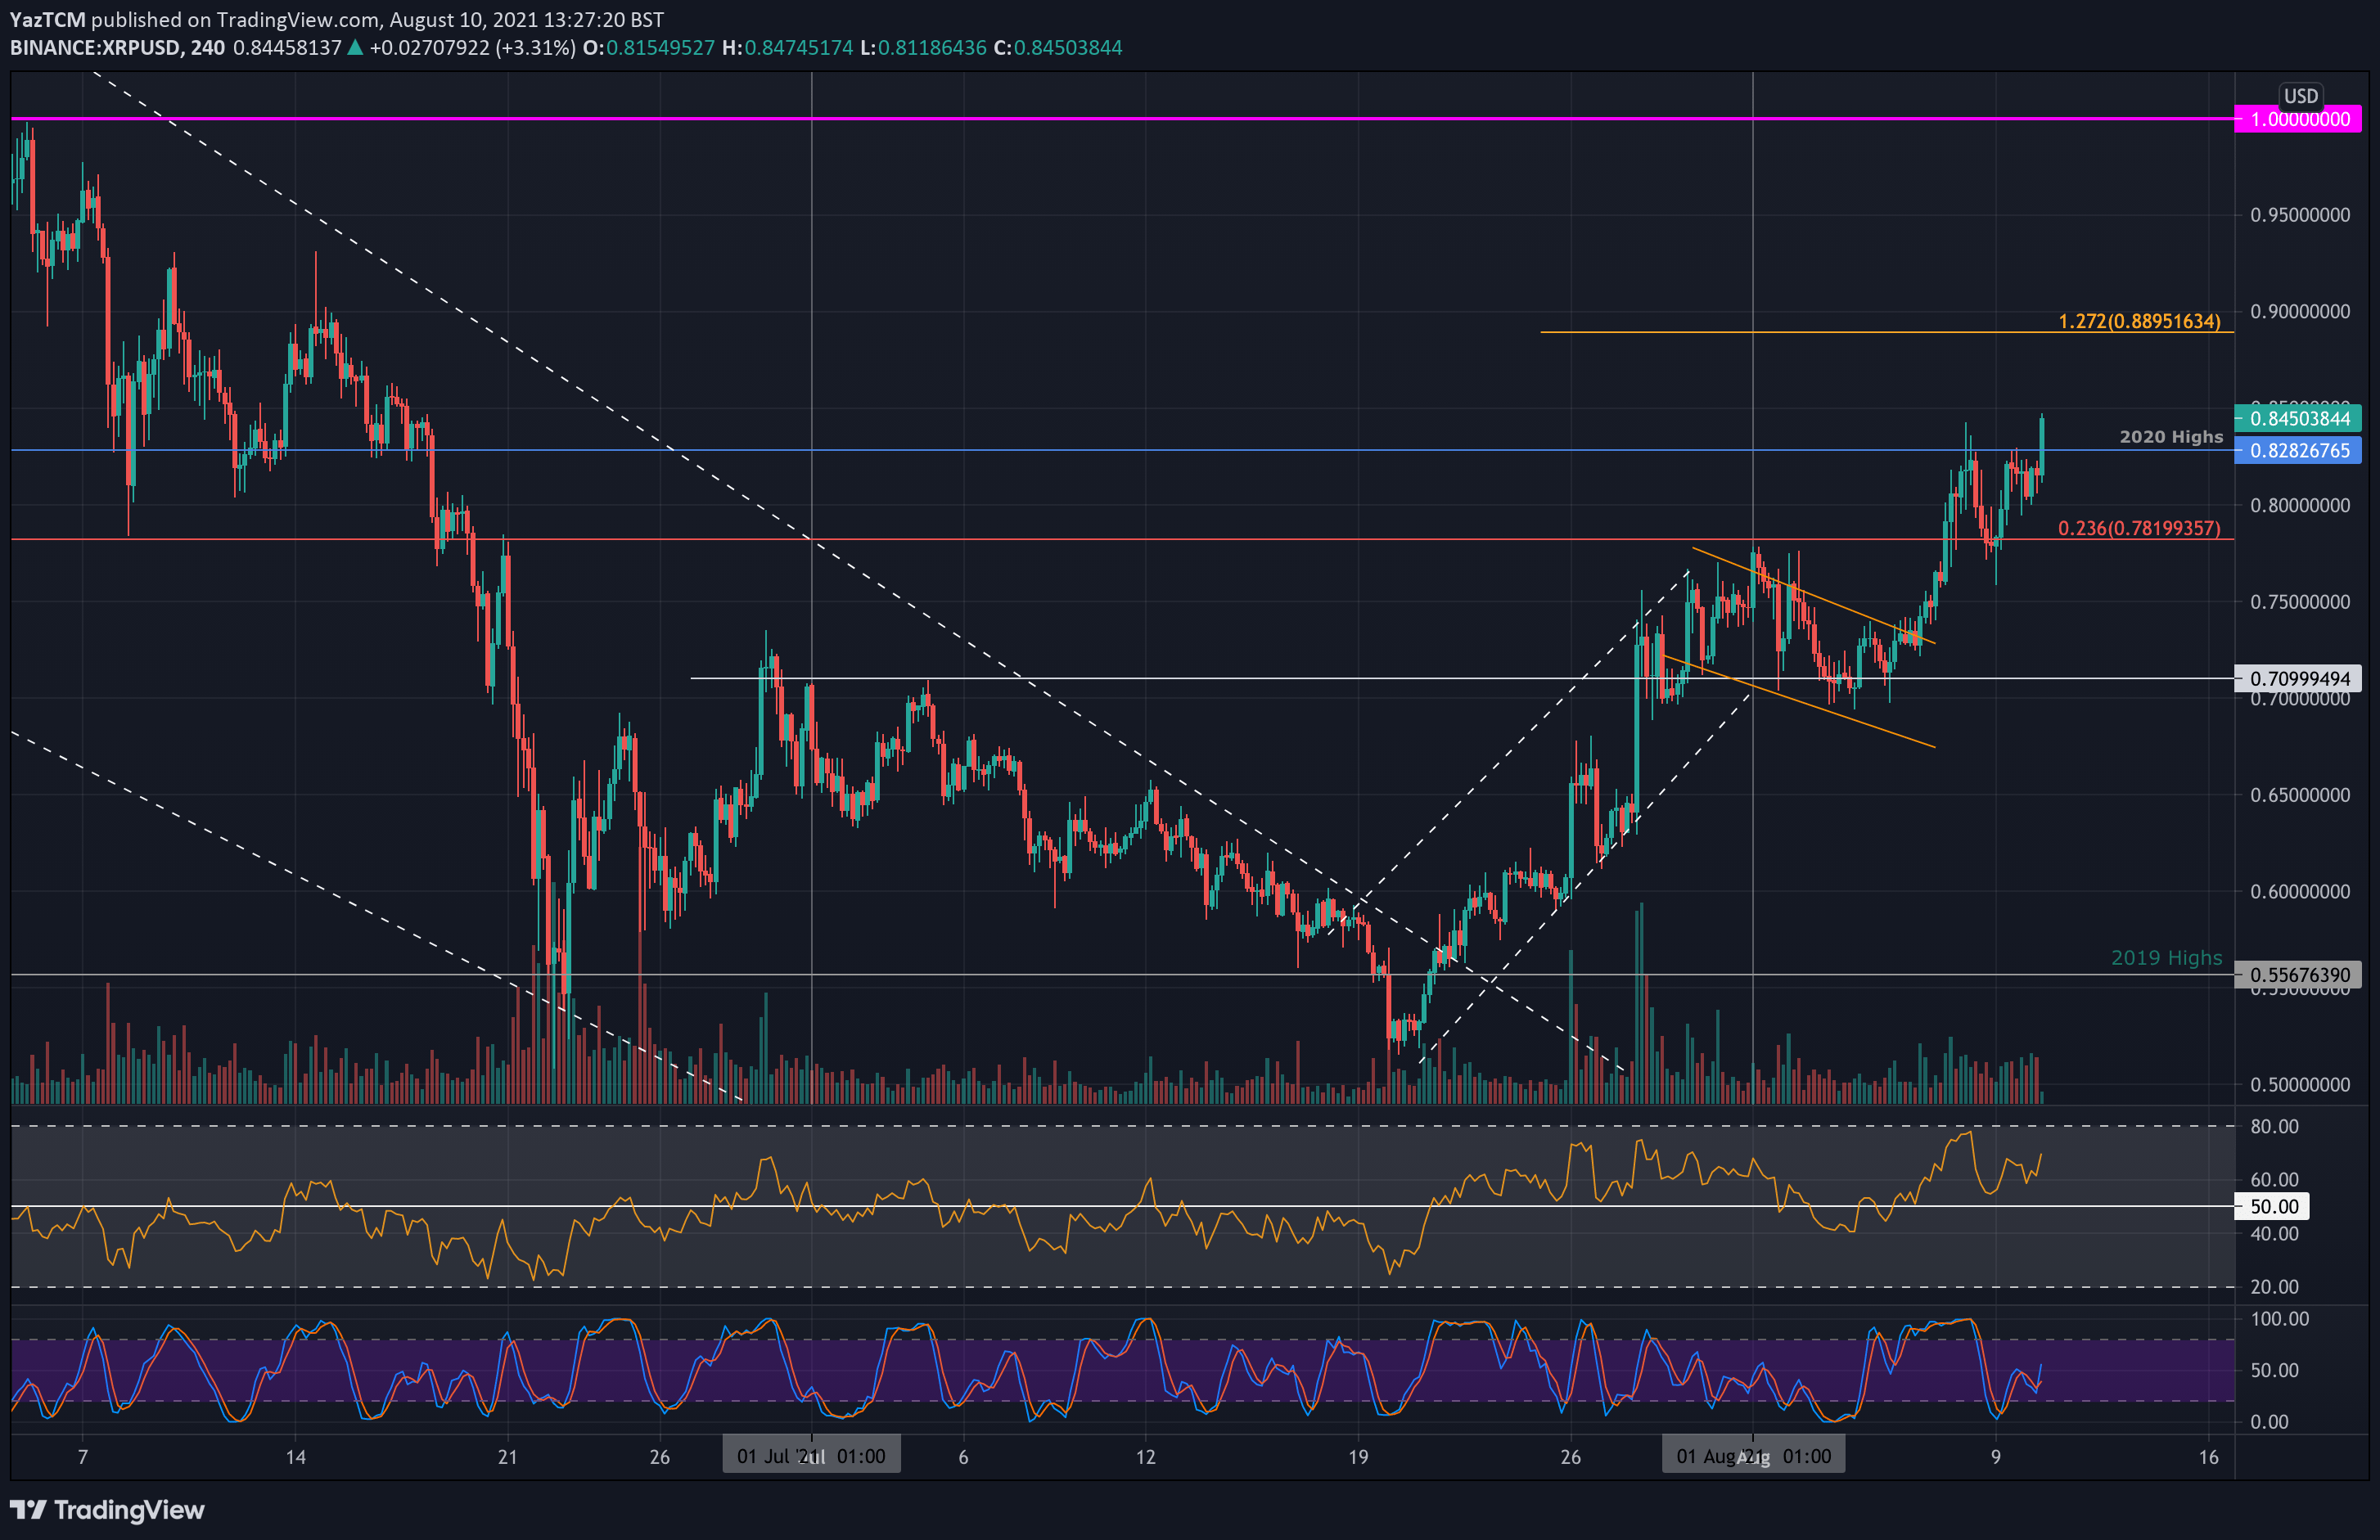
XRP/USD 4-hour Chart. Source: TradingView.
Key Support Levels: $0.8, $0.78, $0.7.
Key Resistance Levels: $9.8282, $0.89, $1.
XRP formed a bullish flag last week after retracing from the 200-day MA resistance at the end of July. The breakout of this flag pattern occurred over the weekend, which allowed it to break above resistance at $0.781 (bearish .236 Fib), climb above the July high, and poke beyond the 2020 high at $0.8282.
The 4-hour chart shows the previous bullish flag being broken over the weekend and the resistance at the 2020 high more clearly. Today’s break beyond this level shows that a new bullish leg higher is in the process of being formed. We will need to wait for a daily closing candle above $0.8282 to confirm this.
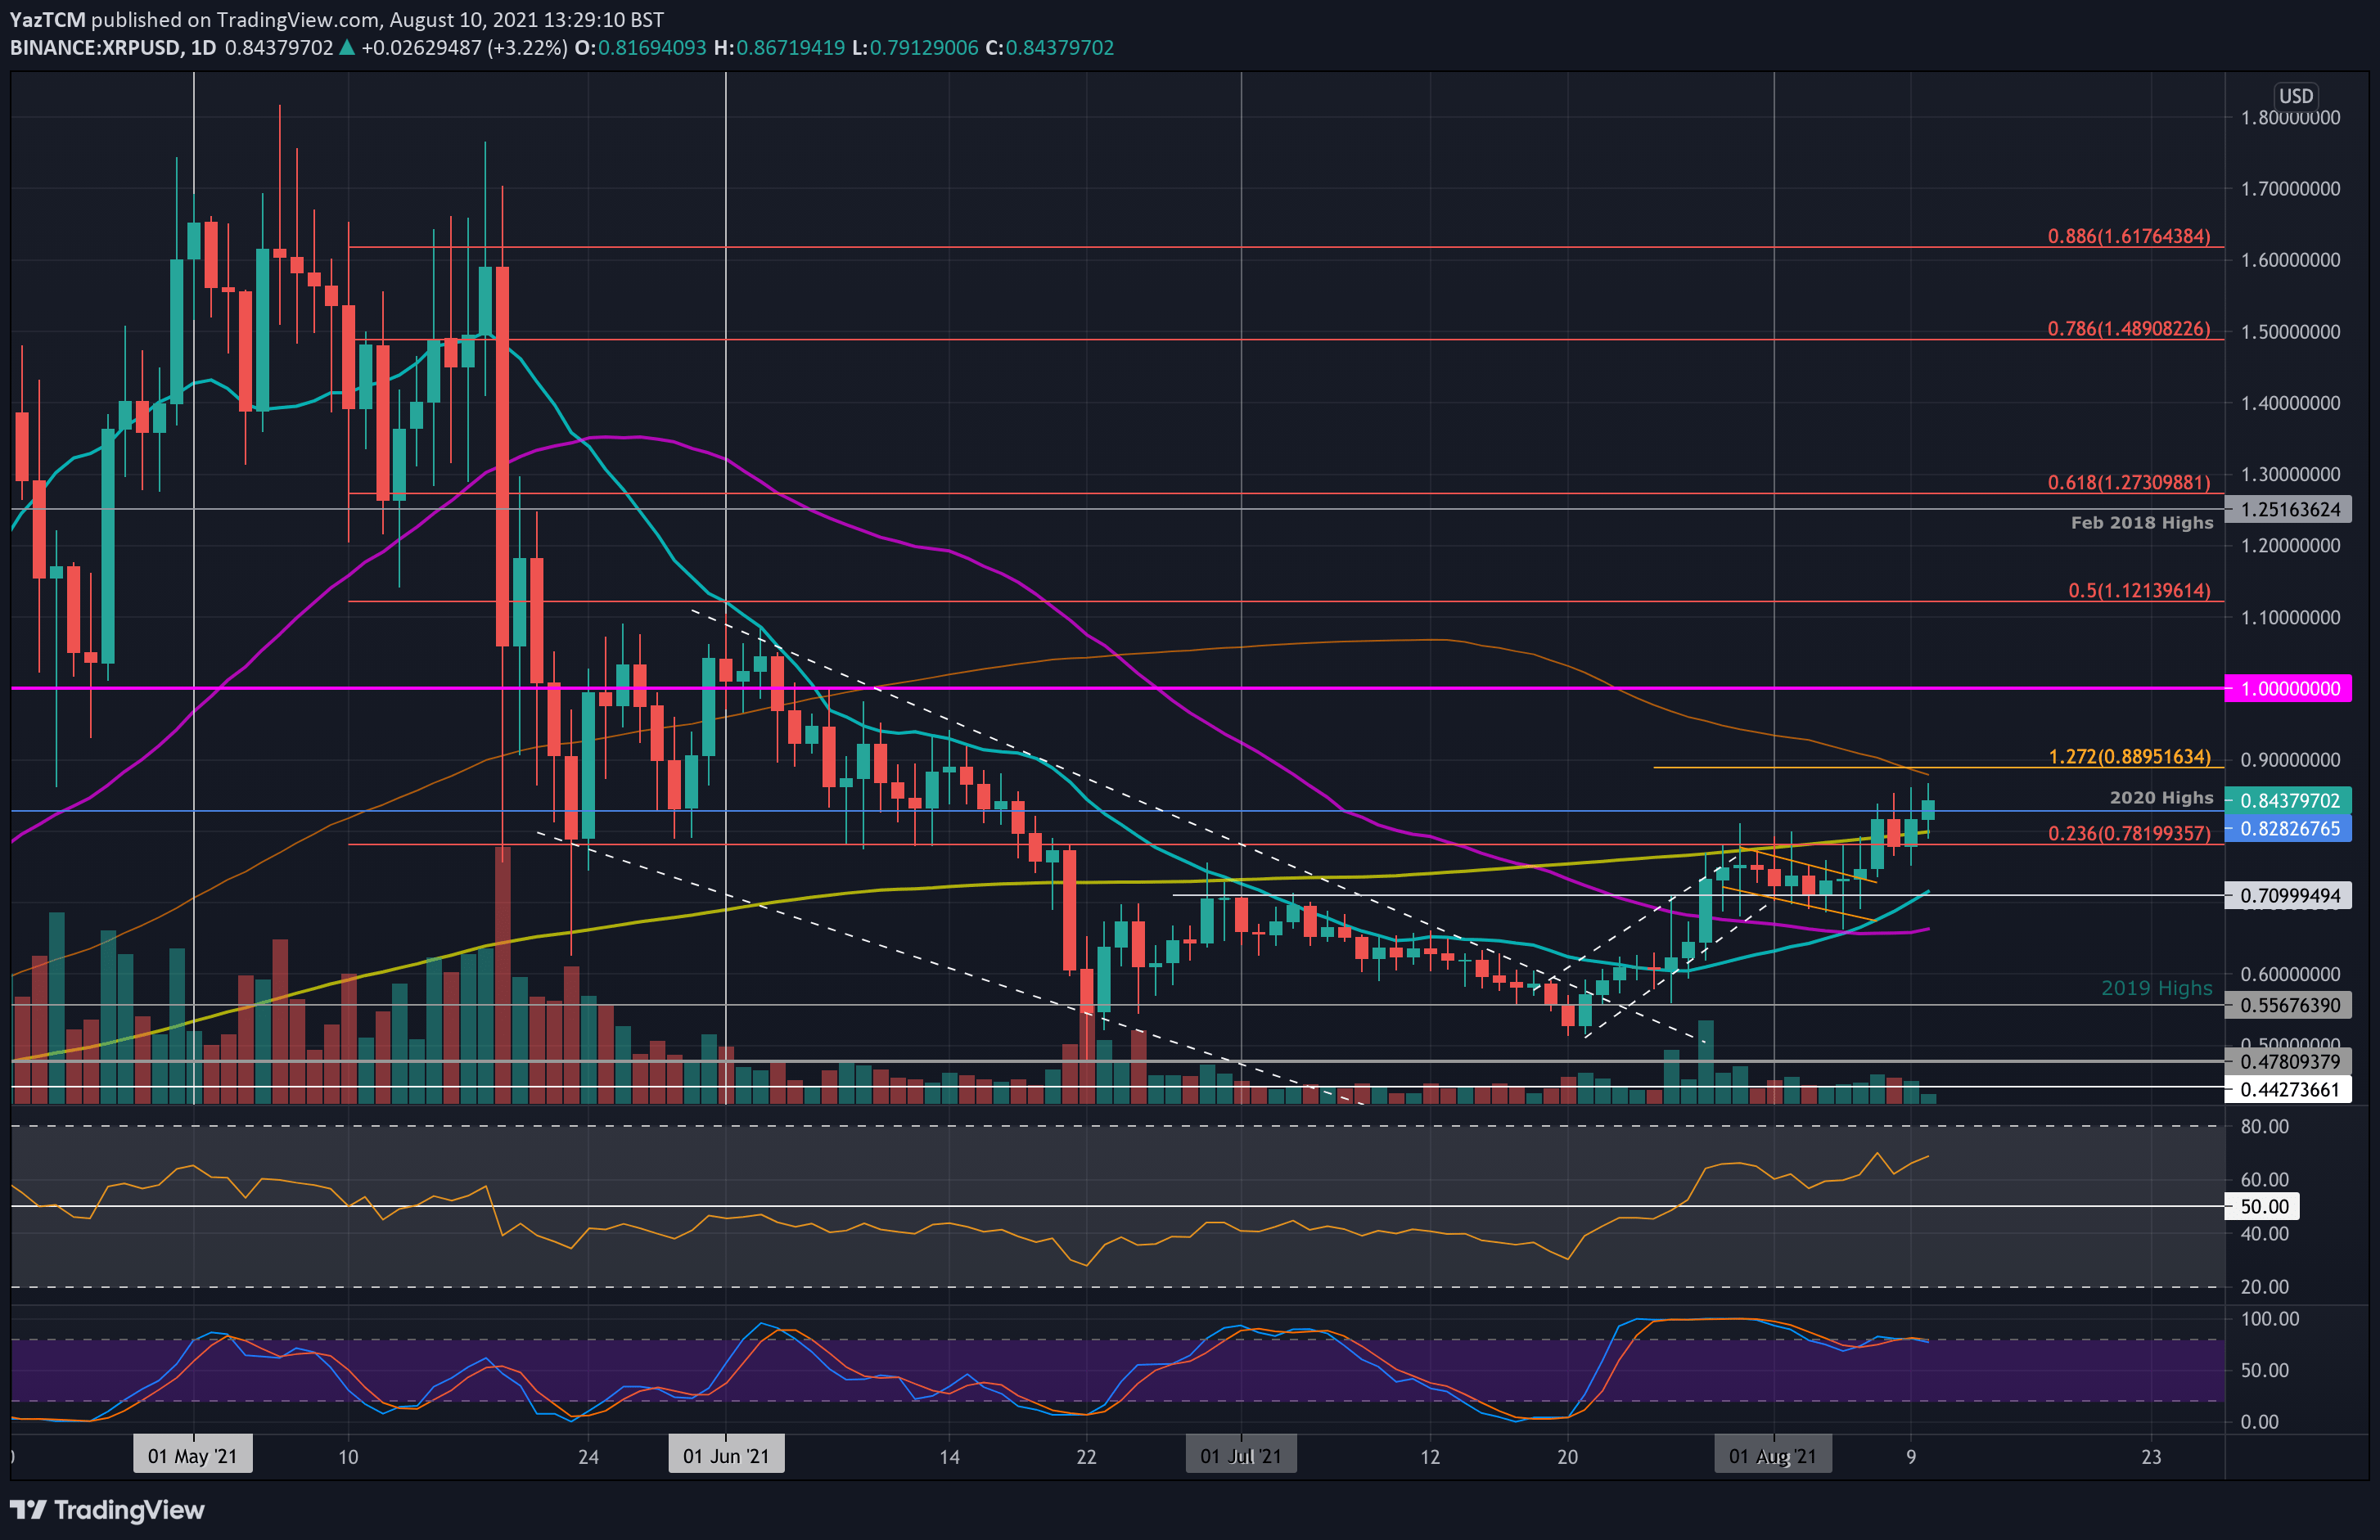
Looking ahead, if the bulls close above $0.8282, the first resistance lies at $0.89 (100-day MA & 1.272 Fib Extension). This is followed by $1, $1.12 (bearish .5 Fib), and $1.25 (Feb 2018 high).
On the other side, the first support lies at $0.8 (200-day MA). This is followed by $0.78, $0.7 (20-day MA), and $0.65 (50-day MA).
The RSI is in the bullish favor and is pressing higher, indicating the bullish momentum is starting to pick up steam.
Key Support Levels: 1800 SAT, 1660 SAT, 1600 SAT.
Key Resistance Levels: 1850 SAT, 1900 SAT, 2000 SAT.
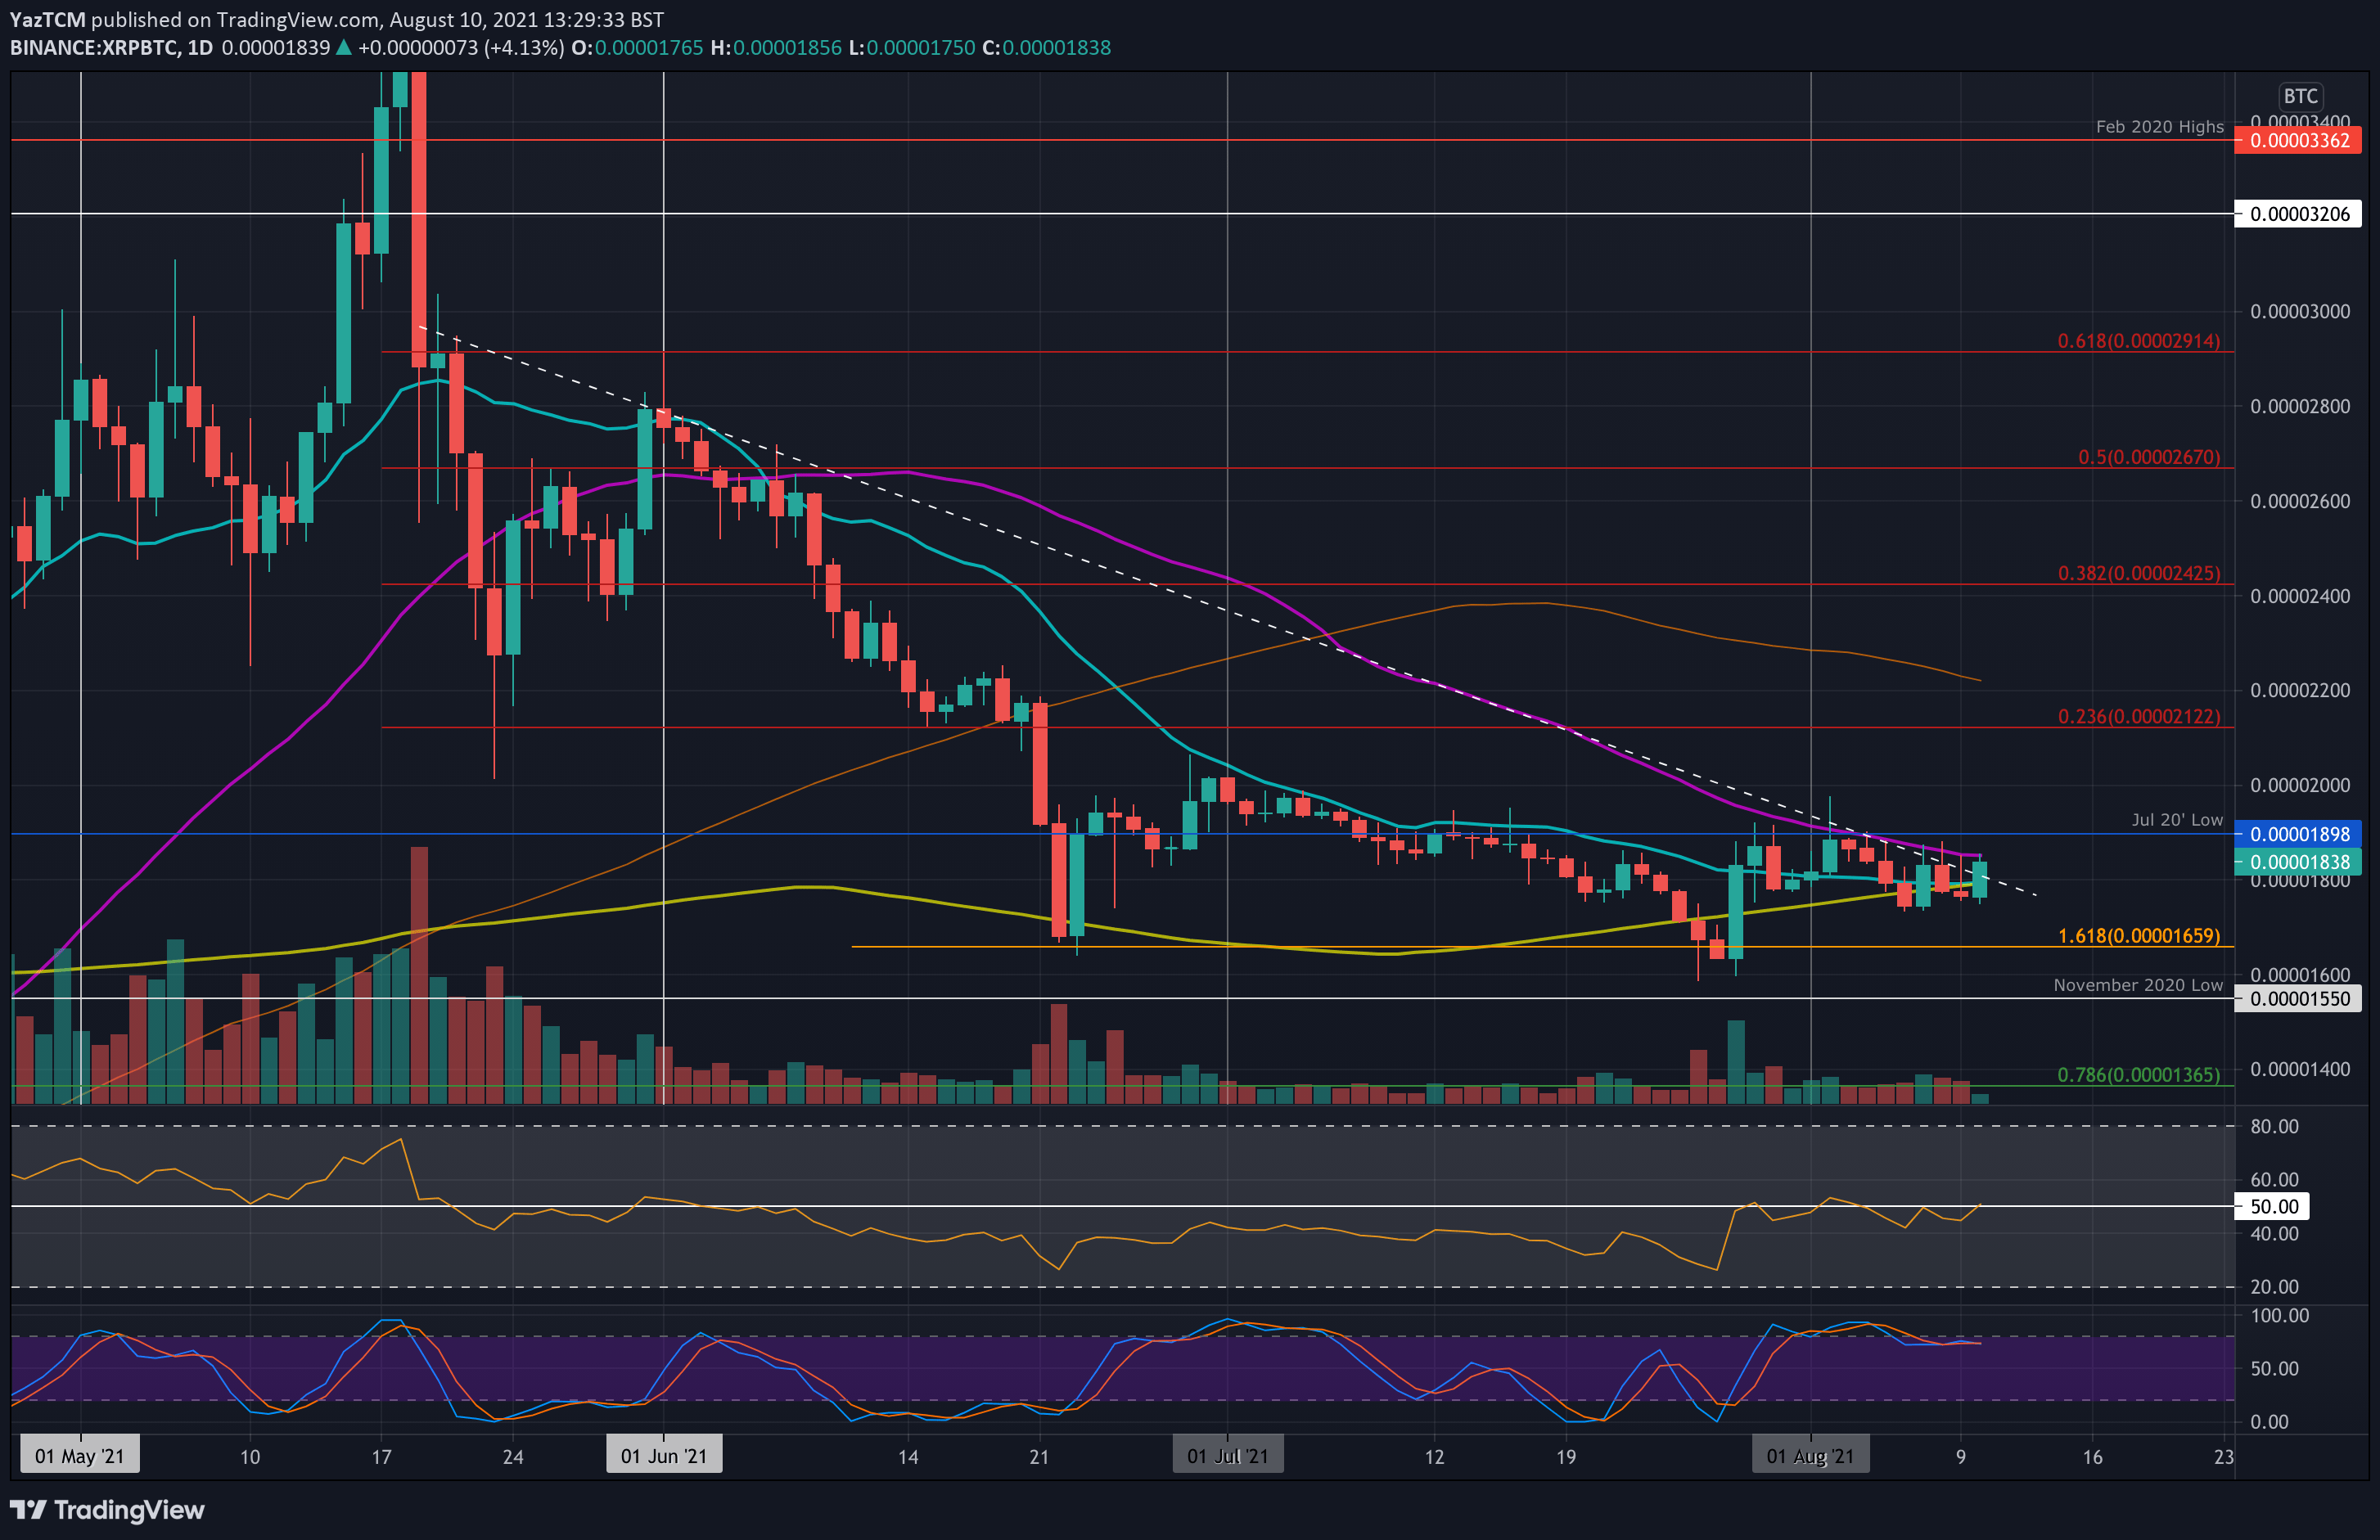
Against BTC, XRP has struggled to break a long-term descending trend line over the past fortnight. The falling trend line is further bolstered by the 50-day MA and is also the July 2020 low.
Today, XRP finally poked above the long-term descending trend line. There is still major resistance ahead at the 50-day MA, and we will need to wait for a daily closing candle above the trend line to confirm the breakout. However, if the daily candle does close above the trend line and XRP continues beyond the 50-day MA, a bullish swing back toward the June highs could be imminent.
Looking ahead, the first resistance lies at the 50-day MA at 1850 SAT. This is followed by 1900 SAT, 2000 SAT, and 2120 SAT (bearish .236 Fib).
On the other side, the first support lies at 1800 SAT (200-day MA). This is followed by 1660 SAT, 1600 SAT (August low), and 1550 SAT (Nov 2020 low).
The RSI recently pushed back above the midline. If it can continue higher, the bullish momentum would be established, and it could allow XRP to pass beyond the 1900 SAT resistance and push beyond the July highs.