XRP has finally shown some signs that it is ready to rebound after increasing by 17% from the low of 3 days ago. The cryptocurrency is now trading at around $0.2849 after experiencing a 14% price decline over the past 30 days.
XRP remains the third-largest cryptocurrency by market value with a market cap of $12.21 billion. If the bulls can continue their momentum, we should see the price of XRP head back towards $0.30.
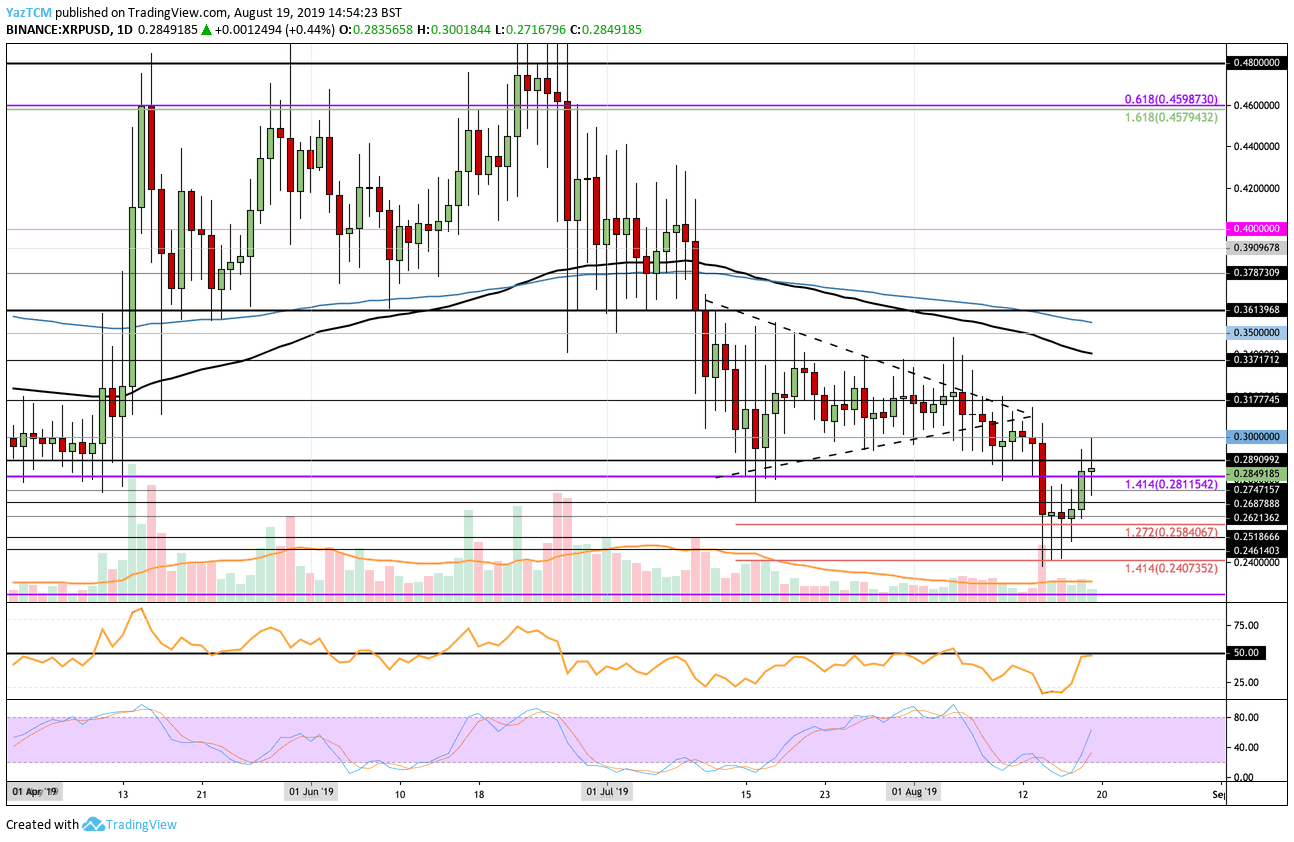
Looking at the XRP/USD 1-day chart:
- Since our previous XRP/USD analysis, the support at the $0.2584 level has provided very strong support to this market. XRP spiked lower into the $0.24 region, but this didn’t last long as it has since rebounded to $0.2849.
- From above: The nearest levels of resistance lie at $0.2890 and $0.29. They are followed by some very strong resistance at the $0.30 level. If the bulls can push the price above $0.30, further resistance lies at $0.3177, $0.325 and $0.3380 (the 100-day EMA).
- From below: The nearest level of support now sits at $0.2811. Beneath this, support can be found at $0.2747, $0.2687, $0.2621, and $0.2584. The support at $0.2584 is expected to hold.
- The trading volume has increased slightly in August but remains around the average level.
- The RSI is currently doing battle with 50. If it can break above it, this will signal that the bulls have taken control, which should push XRP back above $0.30 eventually.
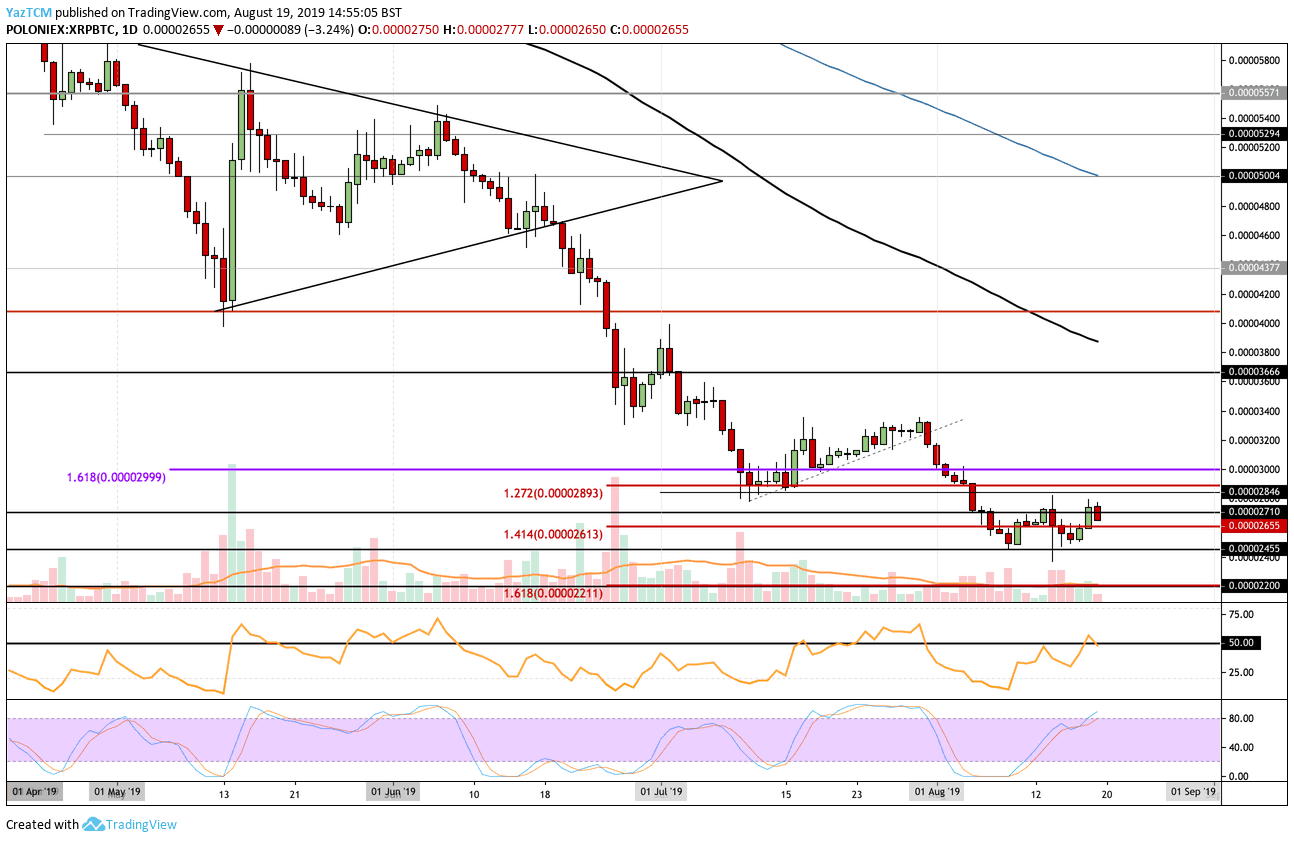
Looking at the XRP/BTC 1-day chart:
- Trading against Bitcoin, XRP has remained relatively stable during August and remains trapped between 2,800 satoshi and 2,455 sat. The support at 2,455 sat was strong and prevented the market from slipping during the past 2 weeks.
- From above: If the market can break above the resistance at 2,800 sat, further resistance lies at 2,893 sat and 3,000 sat. Above this, resistance can be found at 3,200 sat, 3,400 sat, 3,600 sat, and 3,800 sat (the 100-day EMA). If the bulls can continue above the 100-day EMA, higher resistance lies at 4,000 sat, 4,200 sat, and 4,377 sat.
- From below: The nearest levels of support are 2,700 sat and 2,655 sat. Further support is found at 2,455 sat and 2,400 sat. If the sellers break beneath 2,400 sat, we will look for more support at 2,200 sat.
- The trading volume has increased over the past week.
- The RSI is also doing battle with 50 as the bulls vie for control.
SPECIAL OFFER (Sponsored)
LIMITED OFFER 2024 for CryptoPotato readers at Bybit: Use this link to register and open a $500 BTC-USDT position on Bybit Exchange for free!
Disclaimer: Information found on CryptoPotato is those of writers quoted. It does not represent the opinions of CryptoPotato on whether to buy, sell, or hold any investments. You are advised to conduct your own research before making any investment decisions. Use provided information at your own risk. See Disclaimer for more information.
Cryptocurrency charts by TradingView.