The situation continues to look unsteady for Ripple after the market falls by another 3% over the past 24 hours, as of now, while XRP is dropping back below the $0.32 level. Furthermore, against Bitcoin, XRP has continuously created lower lows throughout 2019 as the market now approaches the 6000 SAT area.
Ripple remains ranked in third place in the top-ranked coins by market cap as it currently holds a $13.45 billion cap value.
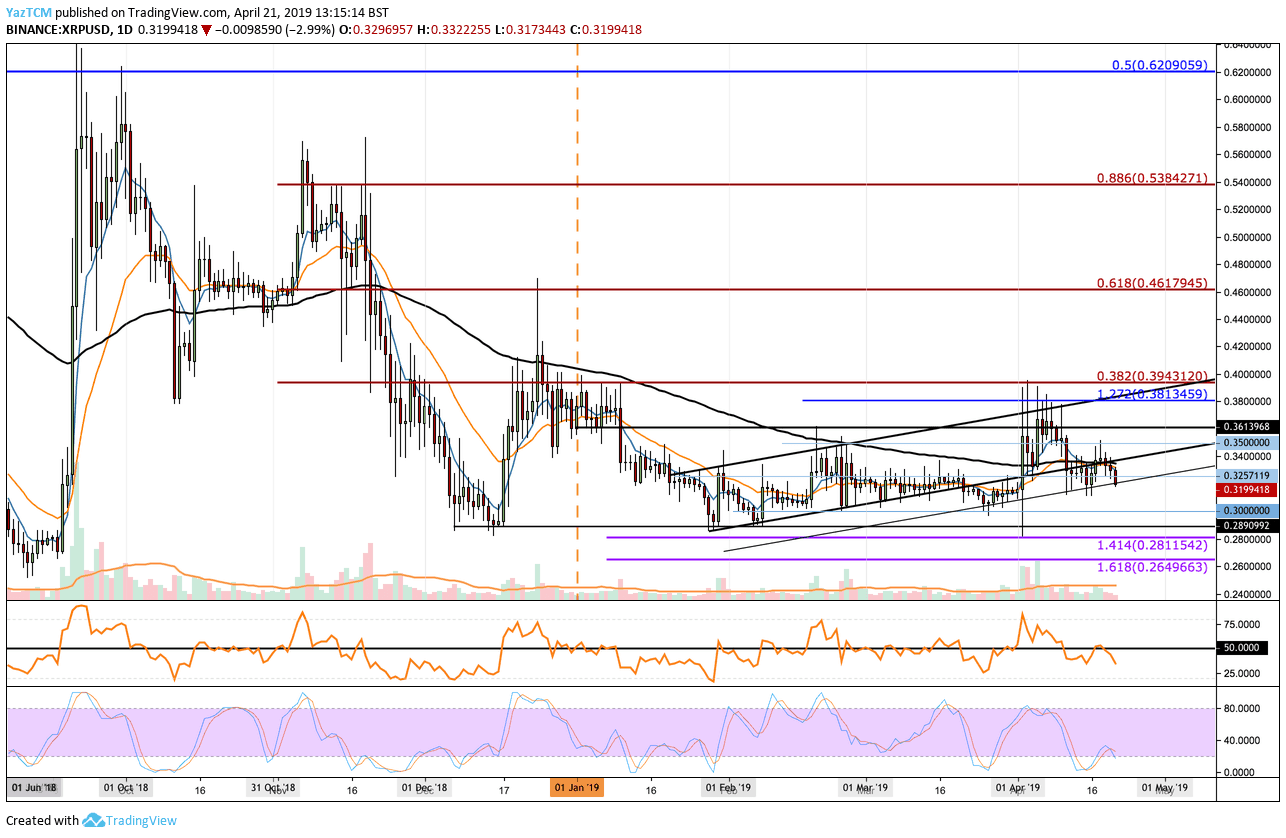
Looking at the XRP/USD 1-Day Chart:
- Against the Dollar, over the past few days, Ripple has struggled to make any movement above the 100-days moving average level. The market had recently dropped back into previous support at the rising trend line which is parallel to the last analysis’ ascending price channel.
- From above: The nearest level of resistance now lies at the 100-days moving average line around the $0.336 area. Above this, further resistance can then be expected at $0.34, $0.35 and $0.3613.
- From below: If Ripple breaks beneath the rising supporting trend-line, we can expect the market to head further lower toward the $0.30 support level. If XRP/USD drops beneath $0.30, further support then lies at $0.2890, which is the December 2018 low. Support beneath can then be expected at $0.2811, $0.27 and $0.2650.
- The trading volume has remained below average and has significantly decreased from the start of April.
- The RSI has broken back beneath the 50 level which indicates that the bears are in control of the market momentum.
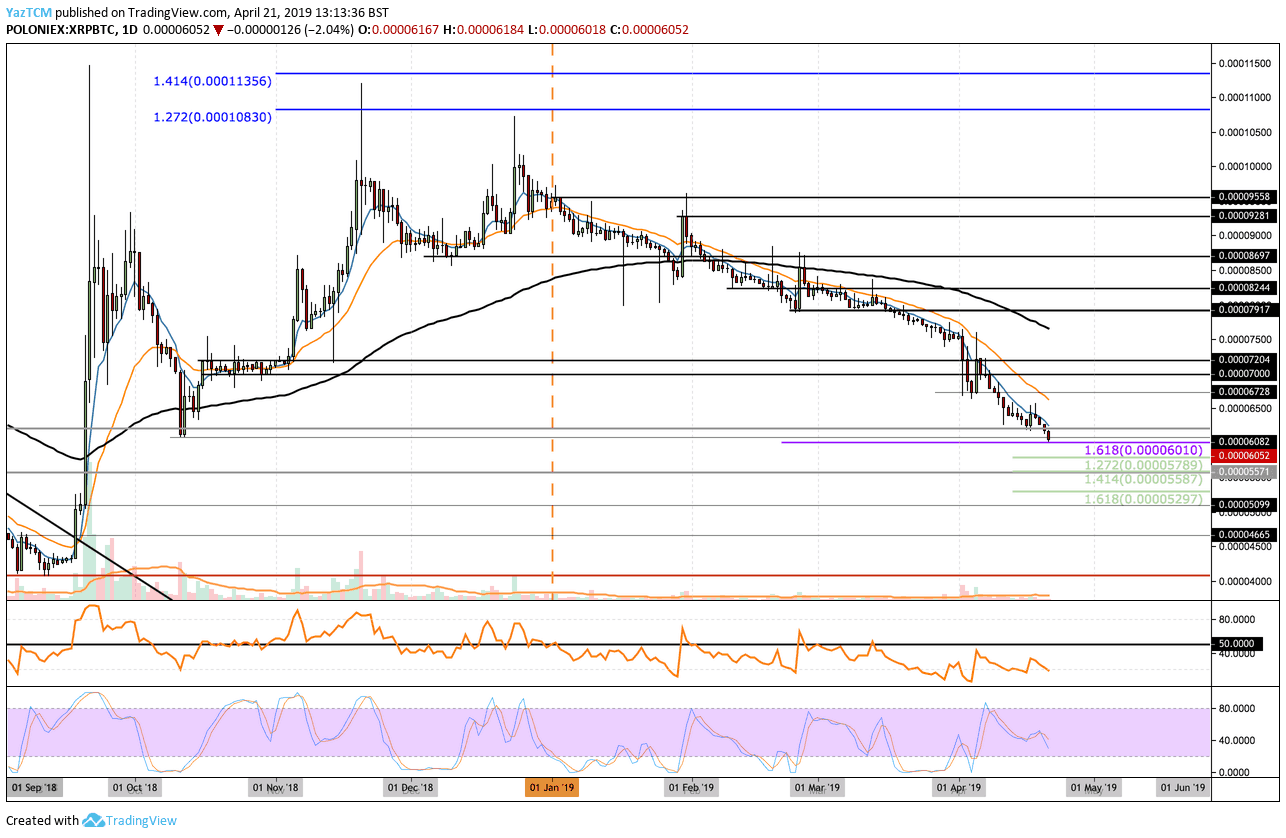
Looking at the XRP/BTC 1-Day Chart:
- Against Bitcoin, Ripple has struggled all year long, so far. XRP had broken beneath the 100-day moving average in February 2019 and has continued to fall lower since. We can see that XRP/BTC has recently approached the 6000 SAT support level after breaking below the October 2018 low around 6100 SAT.
- From above: The nearest level of resistance now lies at 6500 SAT and 7000 SAT. Further resistance can be expected at 7200 SAT and then 7500 SAT which contains the 100-day moving average line (as of now).
- From below: The nearest level of support beneath 6000 SAT now lies at 5790 SAT. Further support lies at 5590 SAT and 5300 SAT, before reaching support at 5000 SAT.
- The RSI has been underneath the 50 level for the entire period of 2019 which indicates that sellers have been in total control with no signs of recovery from the bulls.
SPECIAL OFFER (Sponsored)
LIMITED OFFER 2024 for CryptoPotato readers at Bybit: Use this link to register and open a $500 BTC-USDT position on Bybit Exchange for free!
Disclaimer: Information found on CryptoPotato is those of writers quoted. It does not represent the opinions of CryptoPotato on whether to buy, sell, or hold any investments. You are advised to conduct your own research before making any investment decisions. Use provided information at your own risk. See Disclaimer for more information.
Cryptocurrency charts by TradingView.