Key Resistance Levels: $0.185, $0.215
Key Support Levels: $0.13, $0.11
After opening the weekly candle around $0.215, Ripple saw a massive 50% price plunge following the March 12 crash that hit the cryptocurrency market, while Bitcoin crashed over 40% on the daily. So far, the overall drop was around the 60% mark.
The last 24-hours of trading has allowed Ripple to recover from $0.11, which was yesterday’s low. As of now, Ripple is trading around $0.15.
The price is struggling to pull back at the marked orange area of $0.185, a critical support level that got broken two days ago. We can start to consider a positive price change if XRP can overcome above $0.2 level. As of now, Ripple is still trapped inside a 7-month descending channel.
From a weekly low of $0.11, Ripple bounced to $0.16 today and dropped slightly to $0.151 at the moment. If XRP pushes further above to $0.185 resistance and also manages to reclaim the $0.215 level (the weekly opening price), we can anticipate a bullish setup for XRP to break above the descending channel.
On the other hand, in case XRP fails and remains below the $0.185 resistance, XRP is likely to stay bearish. In the meantime, the closest level of support to watch is $0.13 (Thursday’s closing price) and $0.11, which is yesterday’s low.
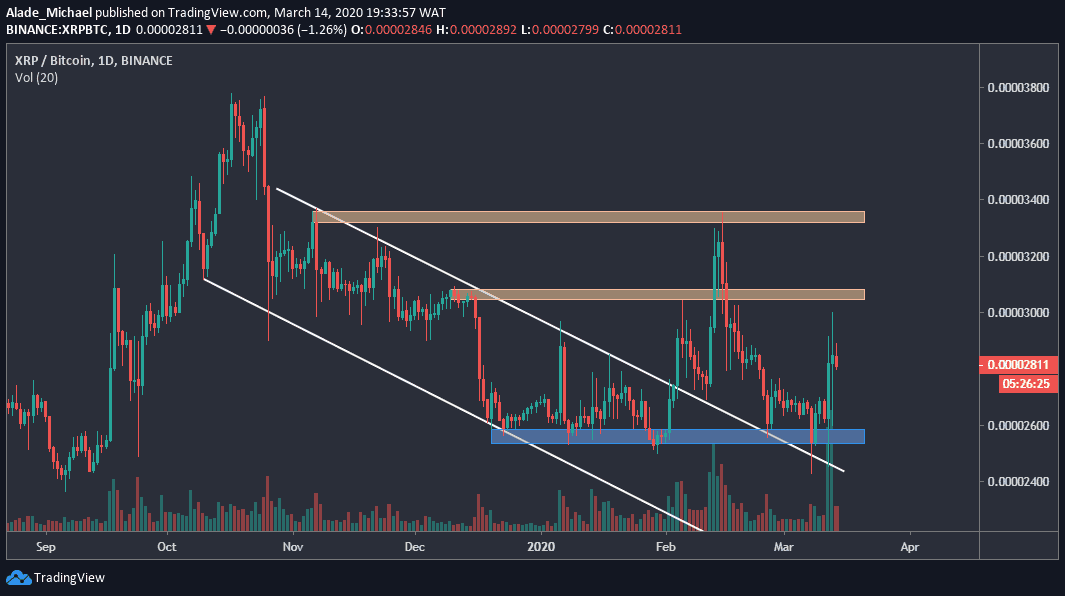
Key Resistance Levels: 3075 SAT, 3300 SAT
Key Support Levels: 2580 SAT, 2400 SAT
Against Bitcoin, Ripple saw a lot of negative price action over the past weeks, but the price had maintained to stay above the 2580 SAT level, which is marked blue on the daily chart. This area has become controversial support for the past few months.
After retracing back to the channel, around the mentioned support, XRP bounced back and showed strength towards a psychological level of the 3000 SAT resistance but quickly got rejected to the 2844 SAT level at the time of writing.
Looking at the daily chart, we can see Ripple is currently indecisive, which shows that the next actual price movement is unknown yet.
From above, the level to keep an eye on is the 3000 SAT, but the bullish momentum would become more valid if XRP can overcome the initial orange area of 3075 SAT, which is the resistance level from December 2019.
Further above, the next key resistance is located at 3300 SAT; the support turned resistance level from mid-February.
From below, the blue area (2580 SAT support) remains the ‘last defense line’ for the bulls. If this support breaks, the price of XRP is likely to collapse into the 2400 SAT support level, which is the September 2019 low.