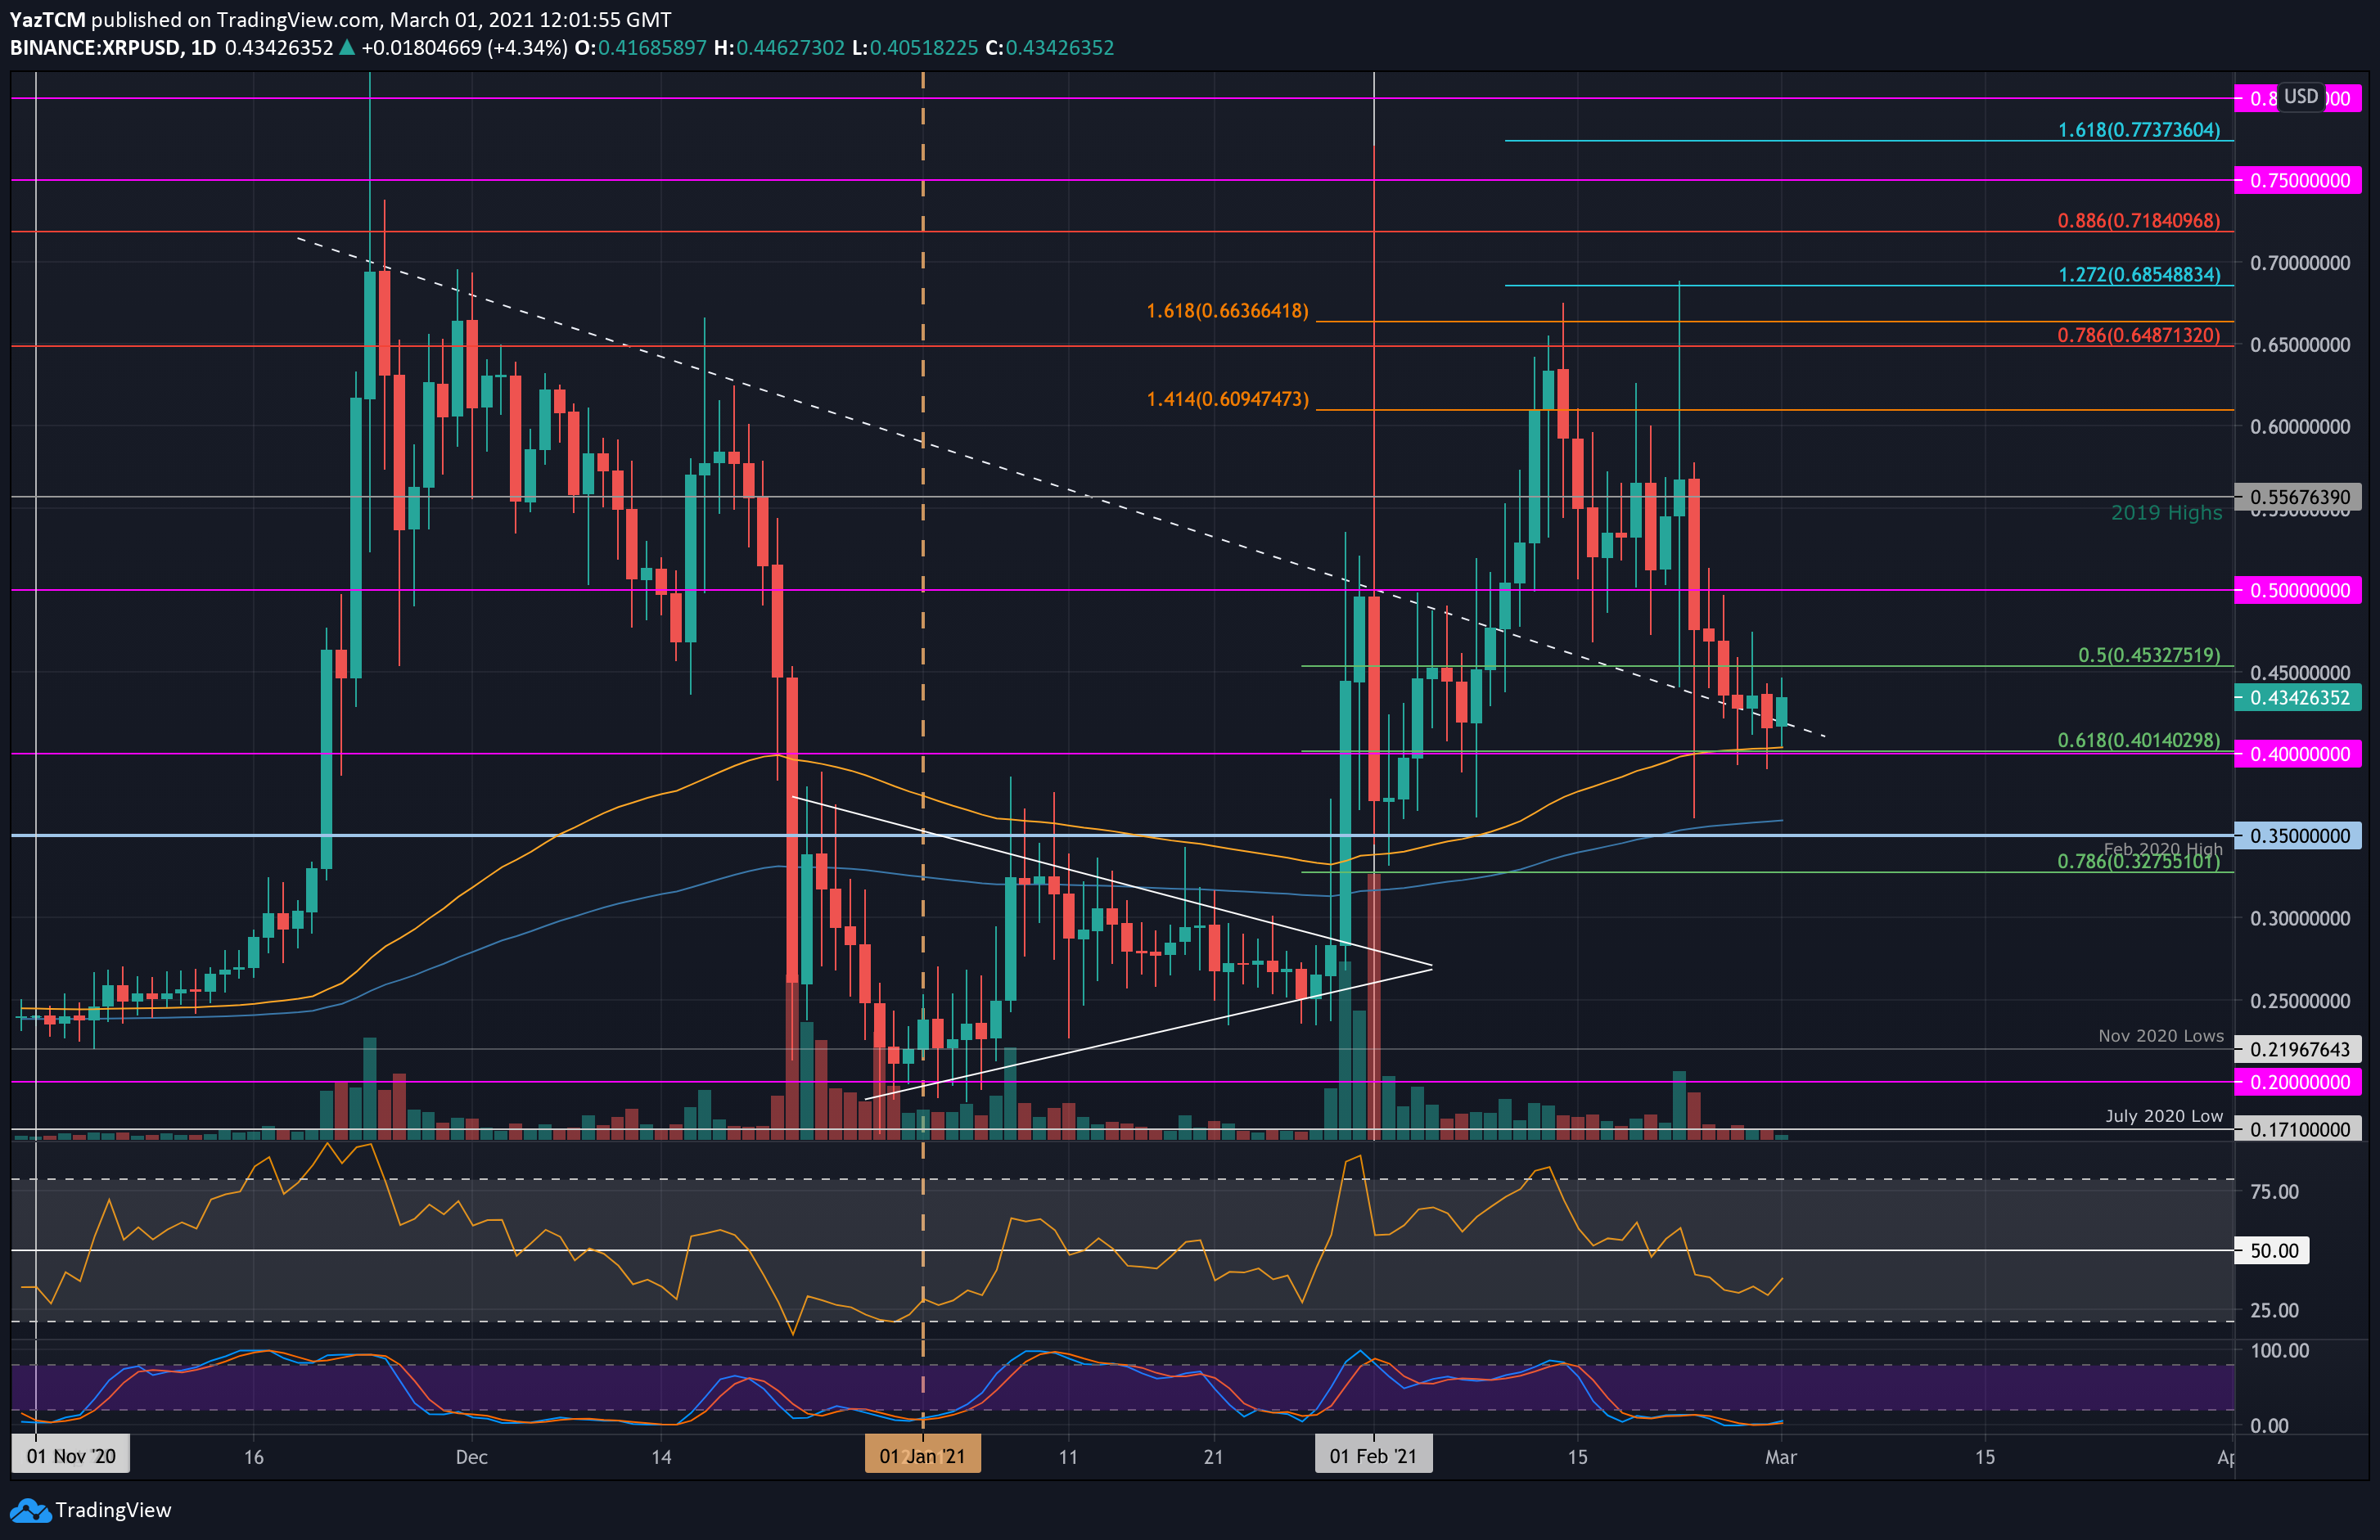
XRP/USD Daily Chart. Source: TradingView
Key Support Levels: $0.4, $0.35, $0.327.
Key Resistance Levels: $0.45, $0.5, $0.556.
At the start of last week, XRP was looking promising, reaching as high as $0.685 (1.272 Fib Extension). However, things changed quickly as soon enough the coin had dropped to around $0.56.
From there, XRP started to head lower throughout the week as the overall market saw a downturn. It quickly collapsed beneath $0.5 and continued until the market found support at $0.4, provided by the .618 Fib and the 100-days EMA.
Interestingly, XRP has been closing each daily candle above a falling trend line that dates back to the beginning of December 2020.
Looking ahead, the first support lies at $0.4. This is followed by $0.35 (200-days EMA & Feb 2020 High), $0.327 (.786 Fib), and $0.3.
On the other side, the first resistance lies at $0.45. This is followed by $0.5, $0.556 (2019 highs), $0.6.
The RSI is in the bearish favor but has seen an uptick recently, which indicates the bearish momentum might be starting to fade. Additionally, the Stochastic RSI is extremely oversold, and a bullish crossover signal should send the market higher.
Key Support Levels: 900 SAT, 867 SAT, 800 SAT.
Key Resistance Levels: 980 SAT, 1000 SAT, 1200 SAT.
Against Bitcoin, XRP has been trading sideways between 980 SAT and 900 SAT for the past five days. The coin had penetrated beneath a symmetrical triangle toward the middle of February, signaling the start of a downtrend.
XRP had attempted to push higher at the start of last week, spiking as high as 1200 SAT, but quickly headed lower over the week to break beneath 1000 SAT.
Moving forward, the first support lies at 900 SAT. This is followed by 867 SAT (January’s upper boundary range), 800 SAT, 700 SAT, and 670 SAT (January’s lower boundary range).
On the other side, the first resistance lies at 980 SAT. this is followed by 1000 SAT, 1200 SAT (December 2017 lows), and 1350 SAT (100-days EMA).
The RSI is in the bearish territory here and looks to be heading lower. If it continues to drop, XRP can be expected to head back into the trading range that was seen through January.