Following the green crypto sentiment, the XRP market has seen some slightly positive action over the past day as it currently trades for $0.3215. However, Ripple has been somewhat struggling against its rivals from the leading cryptocurrencies, excluding BCH and TRX, which experience aggressive price increases.
Ripple remains in the third position of the leading cryptos by market cap, as it holds a $13 billion market cap valuation. However, Ethereum, ranked in 2nd position, is increasing its distance away with a valuation of $14.5 billion.
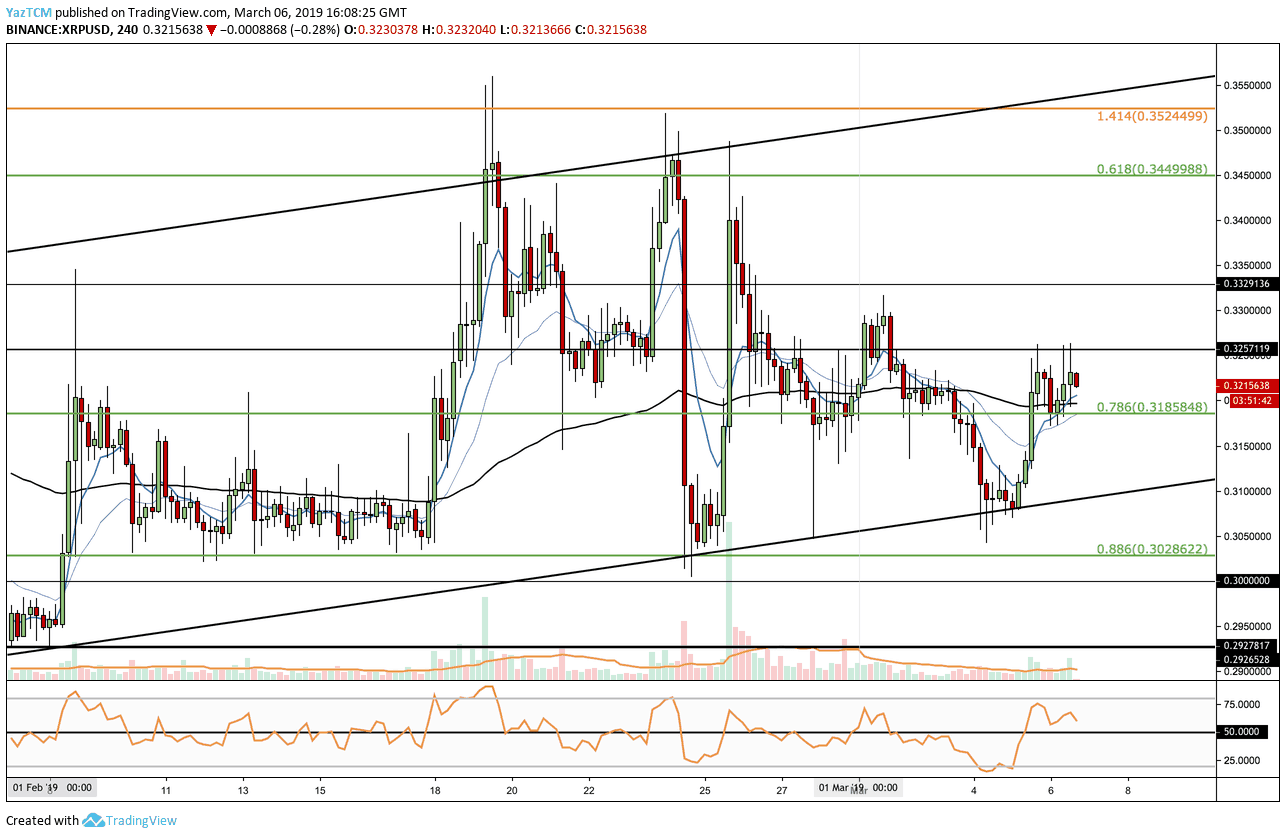
Looking at the XRP/USD 4HR Chart:
- Following our previous Ripple analysis, we can see that the market had rejected from the $0.34 support. It had continued to decline until reaching strong support at the lower boundary of the ascending channel.
- Price action has rebounded at the lower boundary and has risen into resistance at the $0.3257 level.
- From above: The nearest resistance lies at $0.333. Further resistance above $0.34 is located at $0.3450 which is the .618 Fibonacci Retracement, and the $0.3524 level which is the 1.414 Fibonacci Extension level.
- From below: The nearest level of support lies at the $0.3185 which is the .786 Fibonacci Retracement level. Support beneath lies at the lower boundary of the ascending channel followed by more support at $0.3028.
- The RSI has risen into the bullish territory as the bulls dominate momentum (as of now).
Looking at the XRP/BTC 4HR Chart:
- Following our previous XRP/BTC analysis, the market had continued to decline right into support at the 8076 SAT level, at the .5 Fibonacci Retracement.
- The market is now attempting to overcome resistance at the 8250 SAT level.
- From above: The nearest resistance lies at the 8404 SAT level, followed by further resistance around 8543 SAT (.382 Fibonacci Retracement), 8697 SAT and 9000 SATS.
- From below: The nearest support lies at 8000 – 8076 SAT where lies the .5 Fibonacci Retracement level. Further support beneath lies at the downside 1.414 (7971 SATS) and 1.618 (7813 SATS) Fibonacci Extension levels.
- The RSI has also risen into the bullish favor as the bulls dominate momentum.
SPECIAL OFFER (Sponsored)
LIMITED OFFER 2024 for CryptoPotato readers at Bybit: Use this link to register and open a $500 BTC-USDT position on Bybit Exchange for free!
Disclaimer: Information found on CryptoPotato is those of writers quoted. It does not represent the opinions of CryptoPotato on whether to buy, sell, or hold any investments. You are advised to conduct your own research before making any investment decisions. Use provided information at your own risk. See Disclaimer for more information.
Cryptocurrency charts by TradingView.