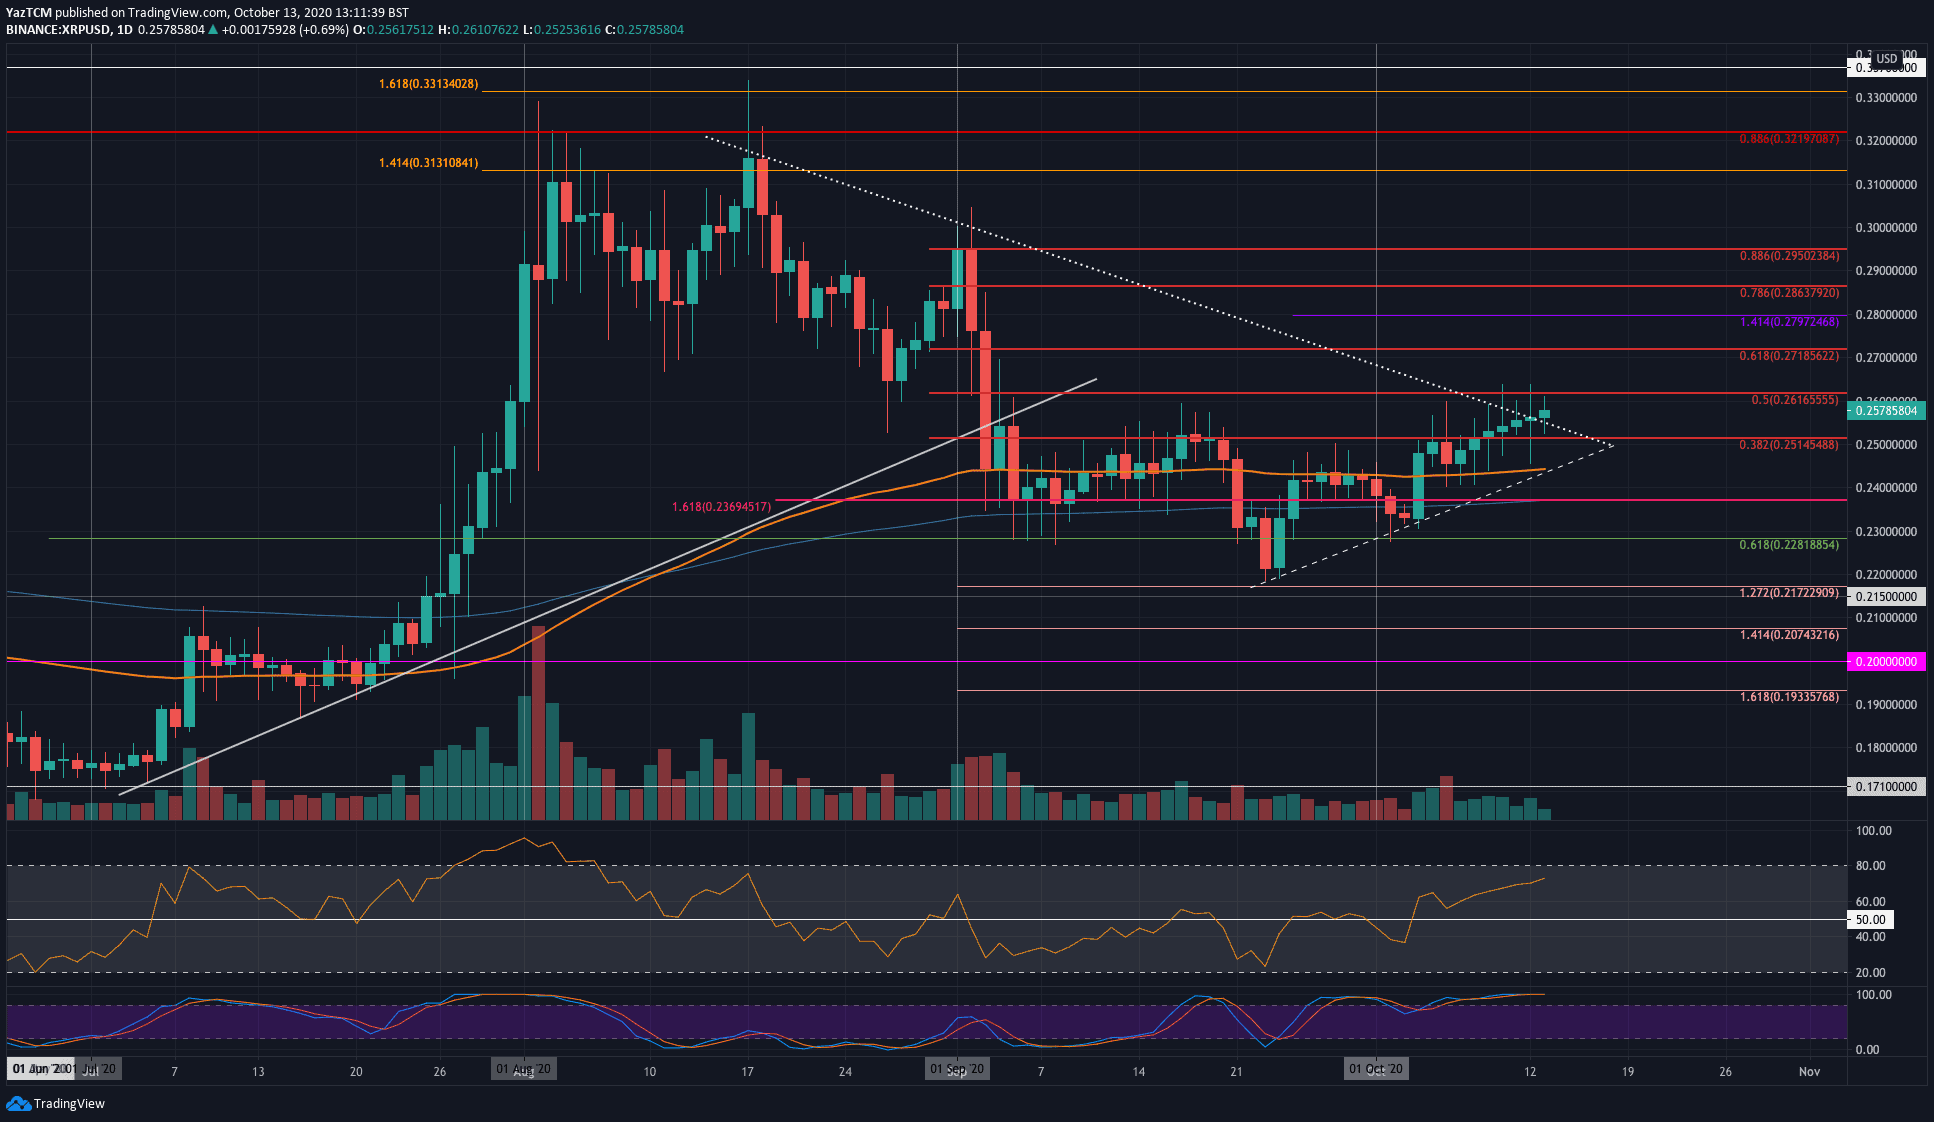
XRP/USD Daily Chart. Source: TradingView
Key Support Levels: $0.25, $0.244, $0.24.
Key Resistance Levels: $0.261, $0.271, $0.28.
At the start of October, XRP bounced from the lower boundary of a short term symmetrical triangle pattern at around $0.23. From there, the buyers pushed higher but initially struggled with the resistance at $0.251 (bearish .382 Fib).
This aforementioned resistance fell over the past week as the bulls continued to break above the triangle today. Although the coin is above the triangle, it still faces strong resistance at $0.261 (bearish .5 Fib) and must penetrate it to turn bullish and head back to the September highs.
Looking ahead, if the bulls can break $0.261, resistance lies at $0.271 (bearish .618 Fib), $0.28 (1.414 Fib Extension), and $0.286 (bearish .786 Fib).
On the other side, the first level of support lies at $0.25. Beneath this, added support is found at $0.244 (100-days EMA), $0.24, and $0.236 (200-days EMA).
The RSI still has room to continue higher before being overbought which indicates the buyers are still not exhausted. However, the Stochastic RSI is already overbought and is primed for a bearish crossover signal.
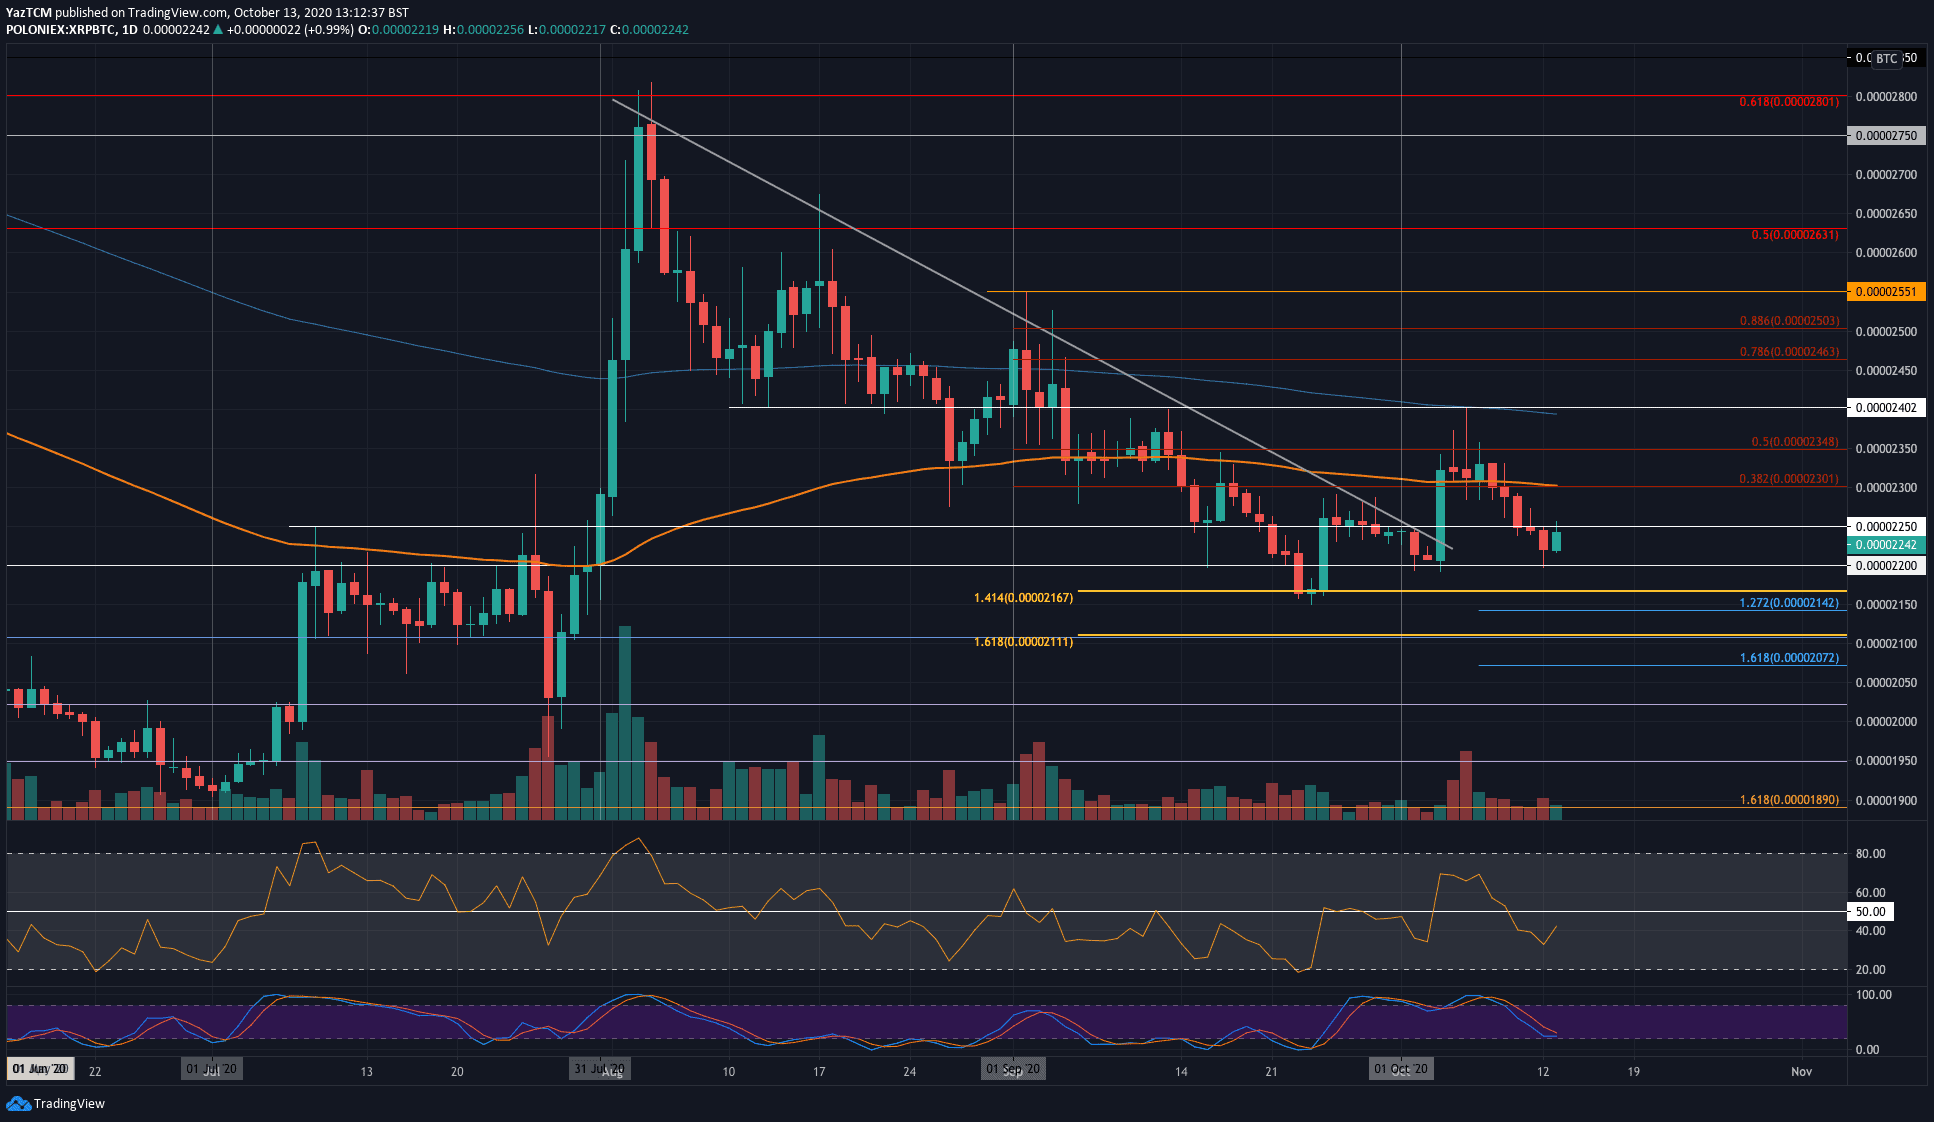
Key Support Levels: 2200 SAT, 2170 SAT, 2140 SAT.
Key Resistance Levels: 2250 SAT, 2300 SAT, 2350 SAT.
XRP struggled against Bitcoin over the past week. The coin fell from above 2300 SAT and continued to drop until support was found at 2200 SAT yesterday. Luckily, the bulls have rebounded from this support as they attempt to push past 2250 SAT today.
For XRP/USD to head back to the $0.3 level, XRP will need to reverse against Bitcoin itself. XRP/BTC will remain neutral until a closing candle appears above the 2400 SAT (200-days EMA) level – at which point, the market would turn bullish.
Looking ahead, once the buyers break 2250 SAT, resistance lies at 2300 SAT (bearish .382 Fib & 100-days EMA), 2350 SAT (bearish .5 Fib), and 2400 SAT (200-days EMA).
On the other side, the first level of support lies at 2200 SAT. Beneath this, support is located at 2170 SAT, 2140 SAT, and 2111 SAT.
The Stochastic RSI is near oversold conditions and is primed for a bullish crossover signal that could put an end to the current downward pressure.