Quick recap: March 12, 2020, following the global markets’ crash, Bitcoin experiencing its worst day ever, while clearing over 50% of its value.
Some blamed the BitMEX liquidation system; some thought Bitcoin was going to zero. The daily high, which was recorded on that day, was $7969 on Bitstamp, while the daily low was $3850. On BitMEX the low was even lower – around $3,600.
Fast forward. Following a healthy higher-lows trajectory along the recovery way, and as mentioned in our previous price analysis from yesterday, the Bitcoin bulls are back. As we discussed here clearly, all signs were bullish for Bitcoin to finally break out the $7200 level, to a new high since the awful March 12.
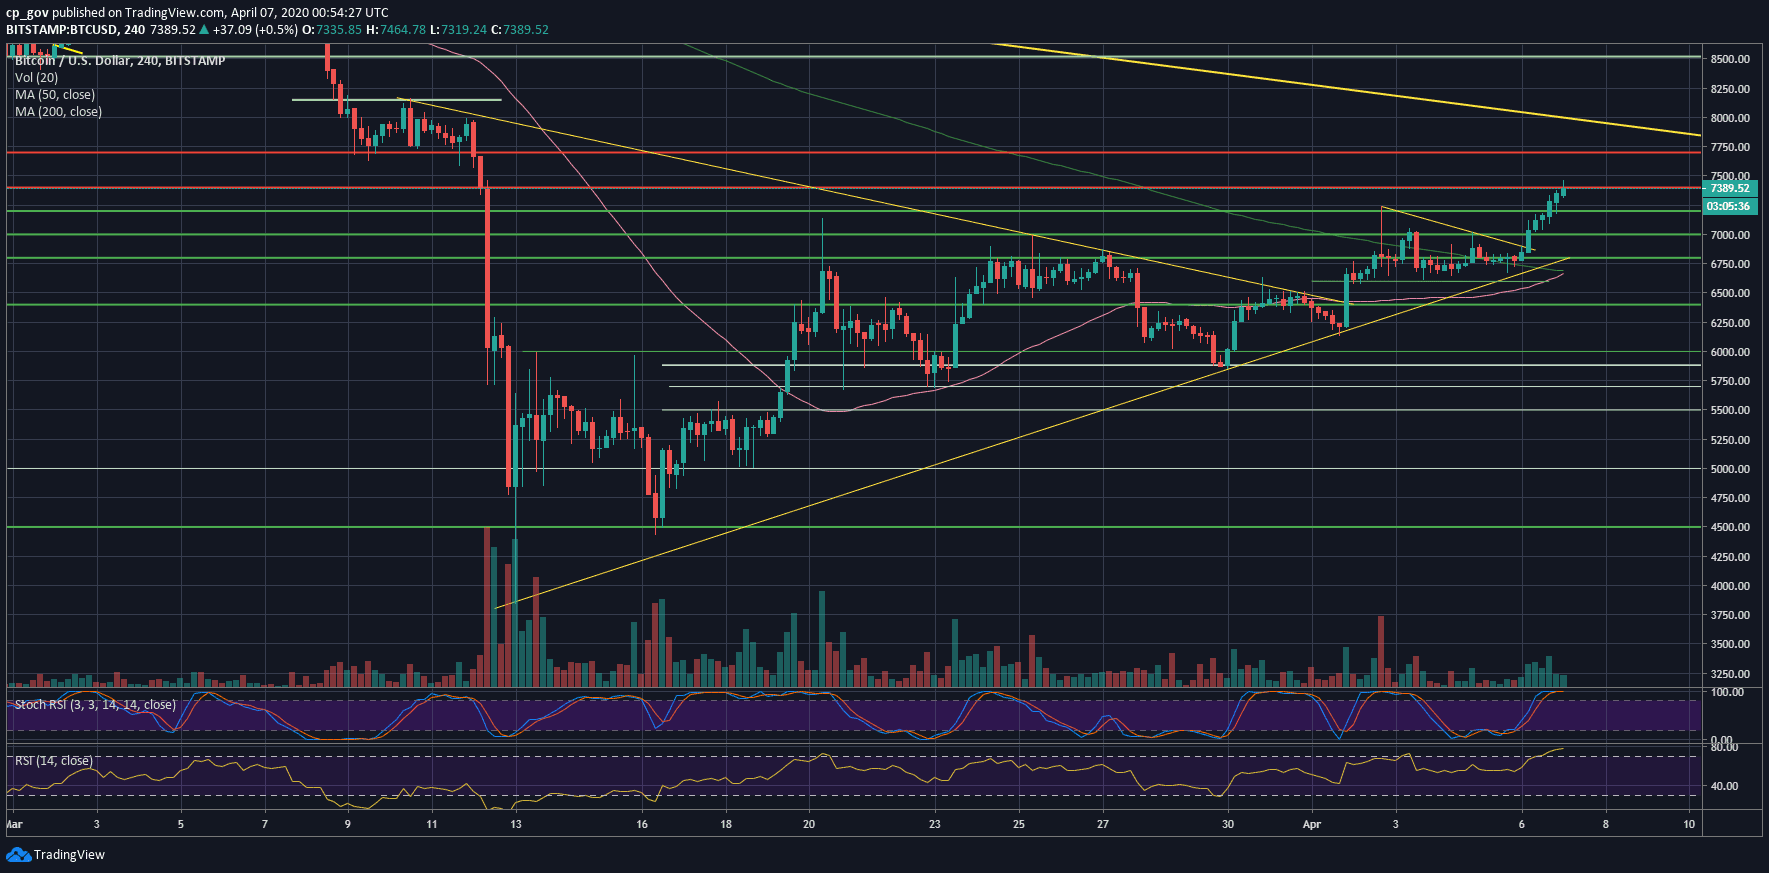
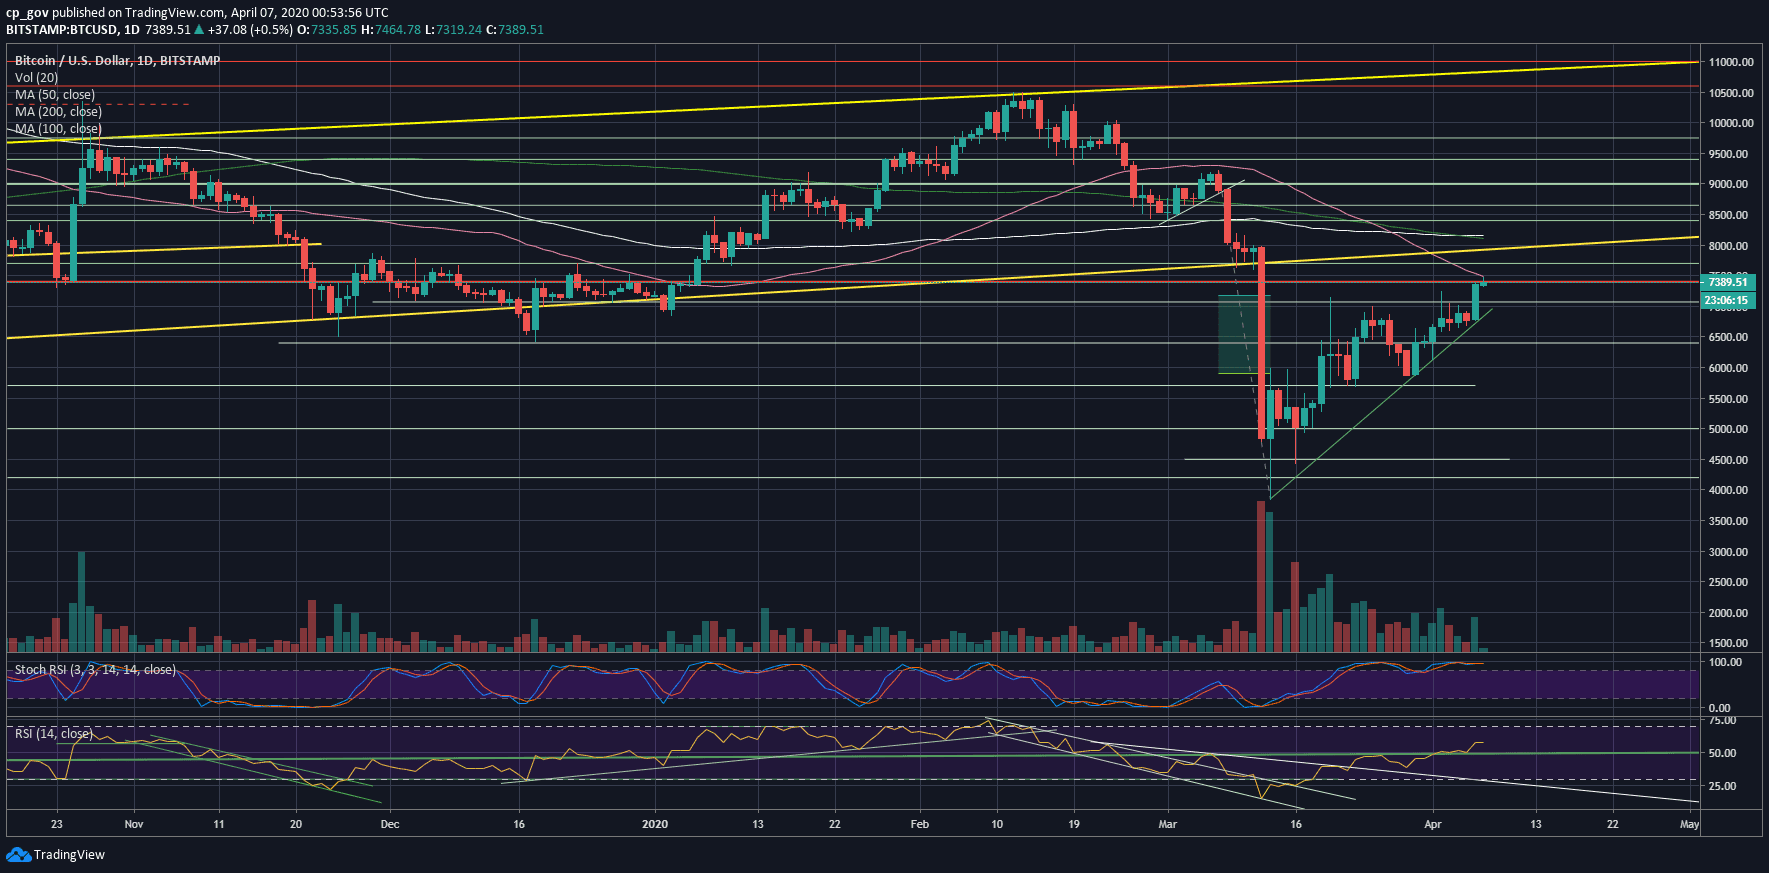
After three failed attempts to break above the Golden Fib level (61.8%) at $7200, Bitcoin finally made it. Since yesterday Bitcoin saw over $600 increase to its price. As of writing these lines, Bitcoin had surpassed the $7400 resistance mark, reaching for the critical 50-days moving average line, marked pink on the following daily chart below.
Bitcoin’s ROI over the past 25 days is now 100%. Wow. But don’t get too excited.
We might see some retracement here, and maybe a retest of the breakout zone at $7200. However, the bulls might take advantage of the momentum, and thrive Bitcoin to where it all started from before the severe plunge of March 12.
We must mention the positive correlation with the global markets. Even Gold had enjoyed that correlation today, following today’s S&P 500 and NASDAQ surge of over 7%. Bitcoin will likely act according to the Wall Street futures.
Due to the Bitcoin price surge, the total market cap is finally reaching beyond the $200 billion mark. The altcoins also joined the party following the decline in the Bitcoin dominance ratio.
Total Market Cap: $209 billion
Bitcoin Market Cap: $135 billion
BTC Dominance Index: 64.5%
*Data by CoinGecko
– Support/Resistance levels: Following the breakout, Bitcoin is now facing $7400 – $7500, along with the 50-days MA line, as the first level of resistance. In the case of a break-up, we should see Bitcoin reaching higher to $7700 and even higher to $7900 and $8000.
The most crucial resistance area for the short-term will be the $8200 which contains both the significant 200-days MA line (light green), as well as the 100-days MA line (white).
From below, the initial support is the prior resistance at $7200. Further below is $7000, $6800, and $6600.
– The RSI Indicator: What a breakout! The RSI indicator is also paving its way, recording its highest level since February 18, when Bitcoin was trading for 5-digits sum. The Stochastic RSI is very high at the overbought levels both in the 4-hour and the daily timeframe; hence, we could see some correction before continuing the bullish trend.
– Trading volume: Despite the bullishness, the real volume is not here yet. Still far from the highs of March.