DOT/USD Daily Chart. Source: TradingView
Key Support Levels: $35.50, $32.71, $30.
Key Resistance Levels: $40.92, $41.63, $45.57.
DOT has been trading within an ascending price channel for the majority of February. Yesterday, it pushed higher from $36 to meet resistance at $35.50 (1.272 Fib Extension & the upper boundary of the price channel).
Today, DOT managed to break the upper boundary of the price channel and start to turn parabolic. It surged as much as 17% to set the new ATH price at $40.92.
Looking ahead, the first resistance lies at the ATH price of $40.92. This is closely followed by $41.63 (1.618 Fib Extension), $45.57 (1.272 Fib Extension – orange), $48 (1.618 Fib Extension – blue), and $50.
On the other side, the first support lies at $35.50. This is followed by $32.71 (.236 Fib), $30, $27.67 (.382 Fib), and $23.60 (.5 Fib).
The RSI is in overbought conditions that show the bulls might be overextended, and it also shows hints of bearish divergence, suggesting a retracement might be needed.
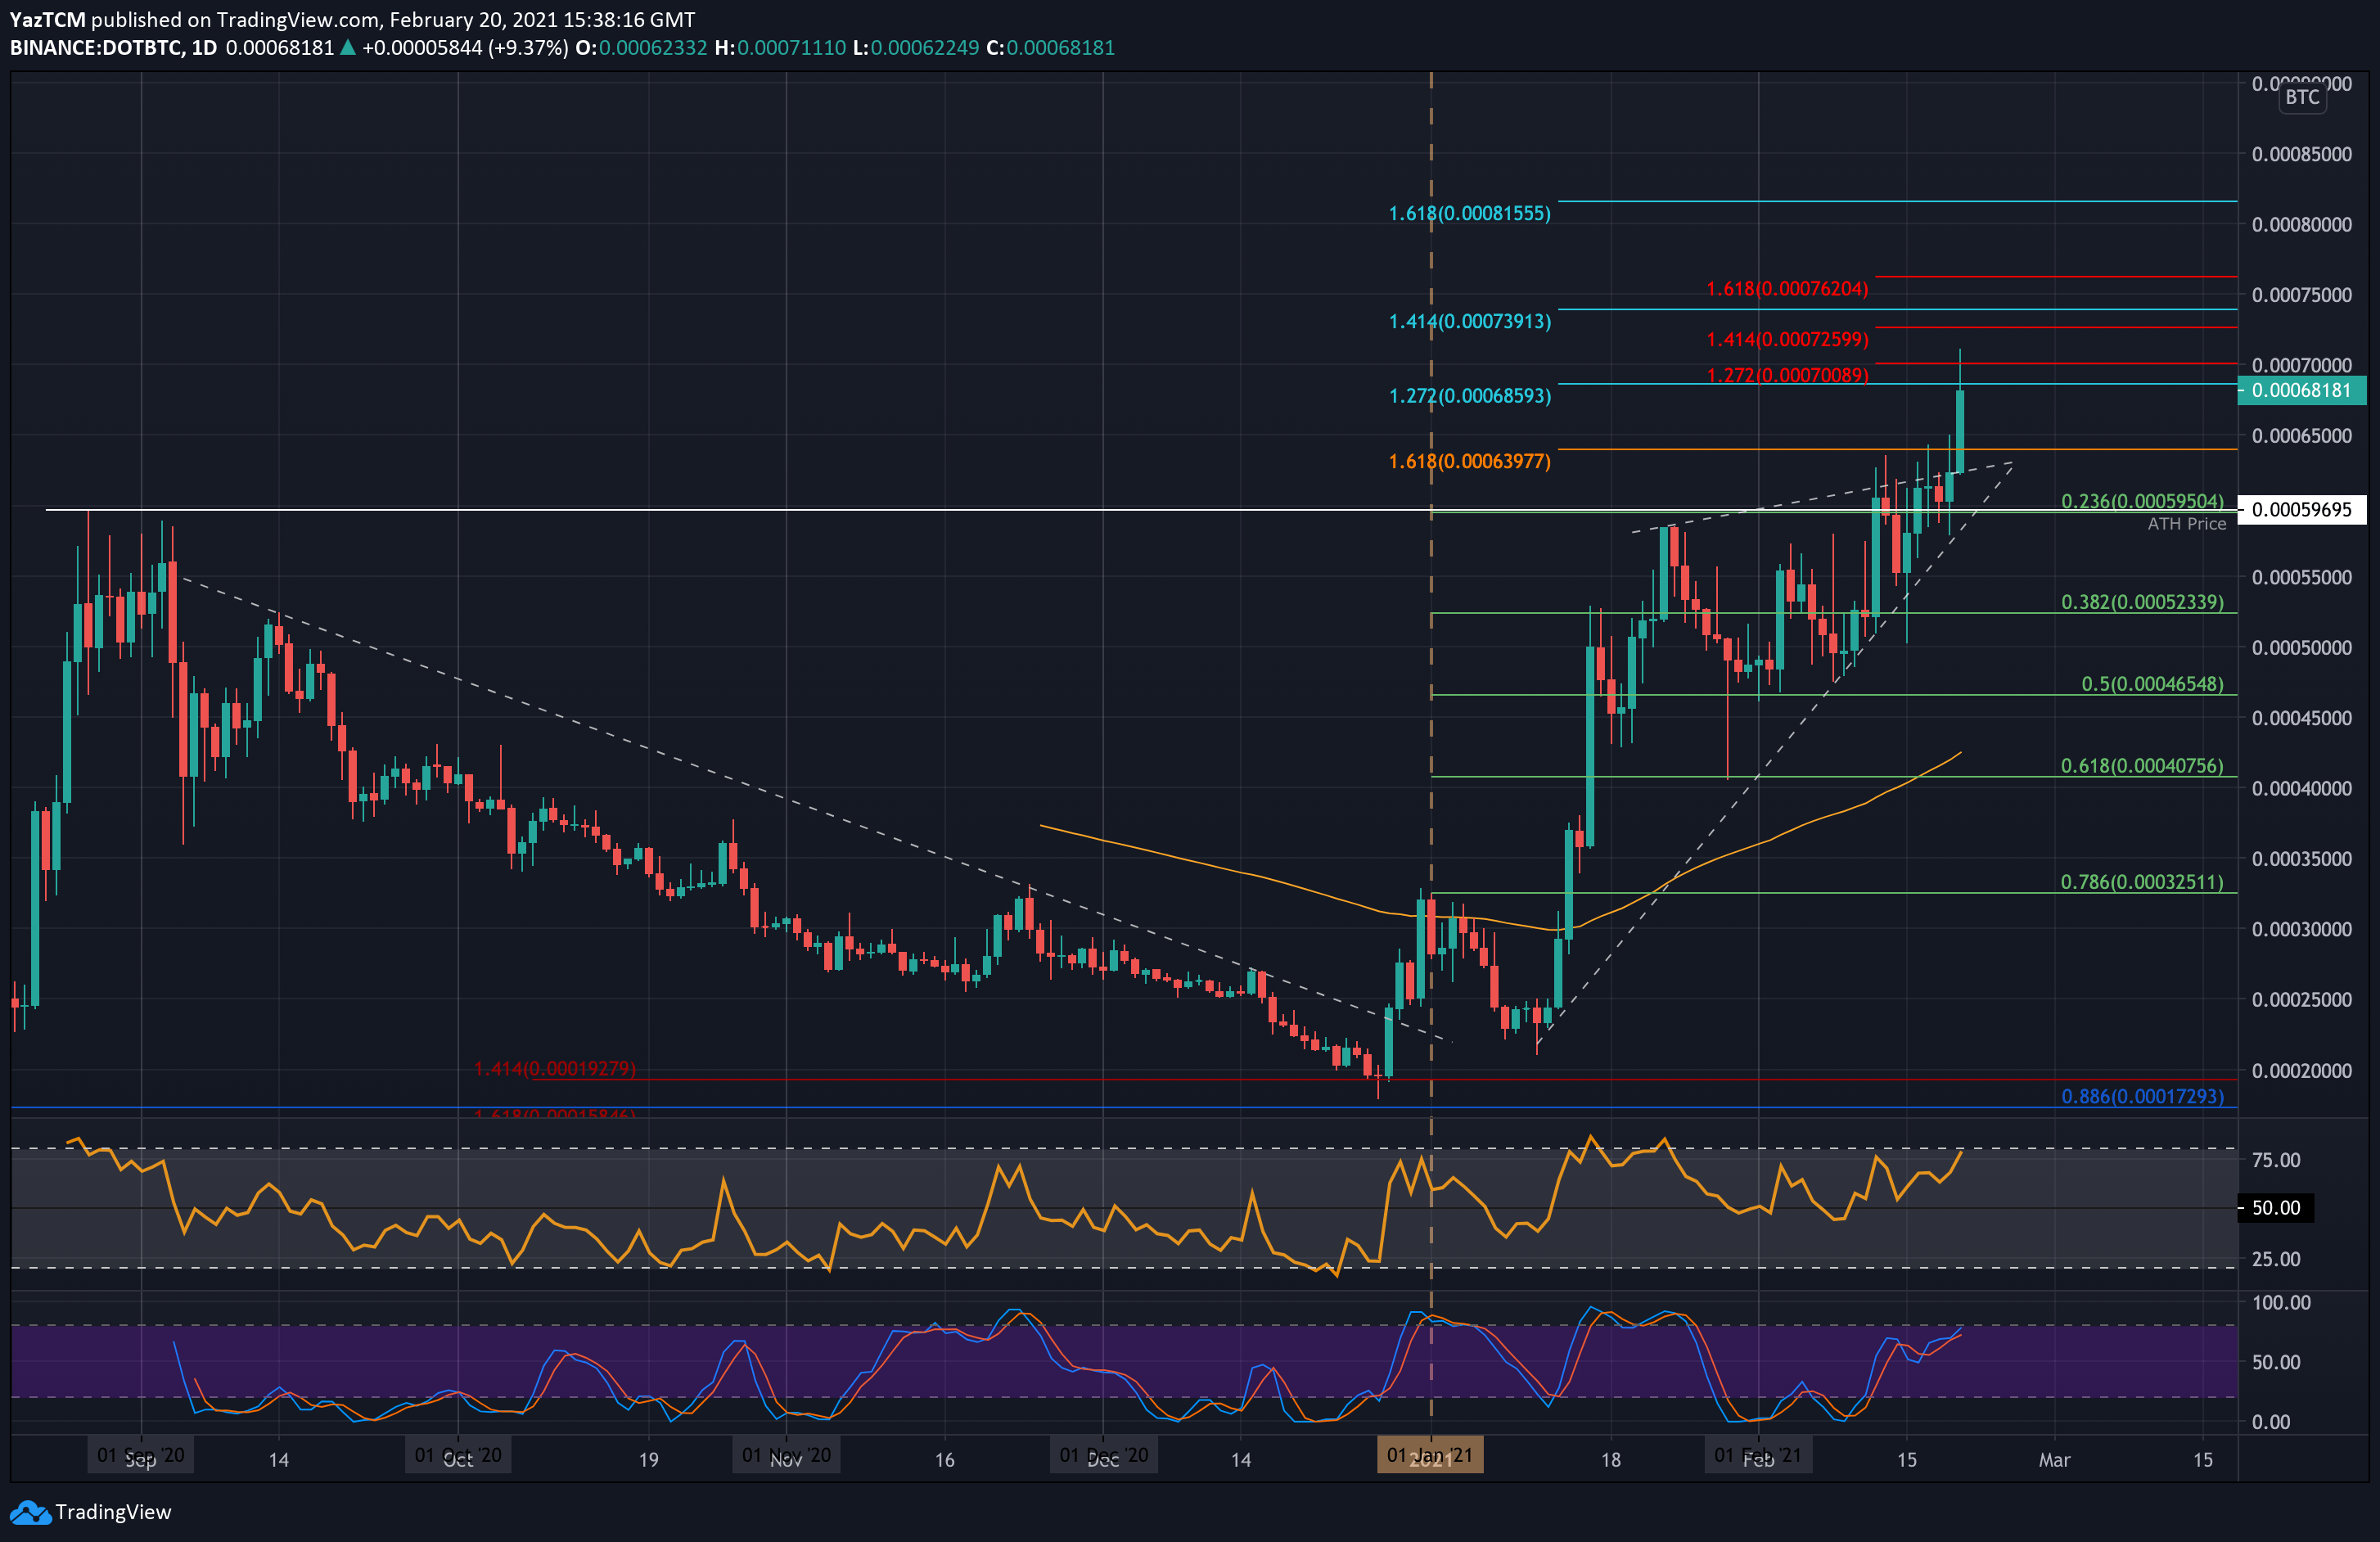
Key Support Levels: 0.00065 BTC, 0.000595 BTC, 0.0005 BTC.
Key Resistance Levels: 0.0007 BTC, 0.000739 BTC, 0.000762 BTC.
Against Bitcoin, DOT has been trading within a rising wedge for February. It had managed to break the previous ATH price of 0.000596 BTC earlier this week but became stuck at the upper boundary of the wedge.
It penetrated this wedge’s upper boundary today as it surged into the current price at 0.000681 BTC. It had surged higher, reaching as high as 0.000711 BTC but has since dropped to the current price.
Looking ahead, the first level of resistance lies at 0.0007 BTC. This is followed by 0.000739 BTC (1.414 Fib Extension – blue), 0.000762 BTC (1.618 Fib Extension – red), 0.0008 BTC, and 0.000815 BTC (1.618 Fib Extension – blue).
On the other side, the first support lies at 0.00065 BTC. This is followed by 0.000595 BTC (.236 Fib), 0.0005 BTC, and 0.000523 BTC (.382 Fib).
The RSI is rising and is still yet to become overbought. This suggests there is still room for the bulls to push higher.