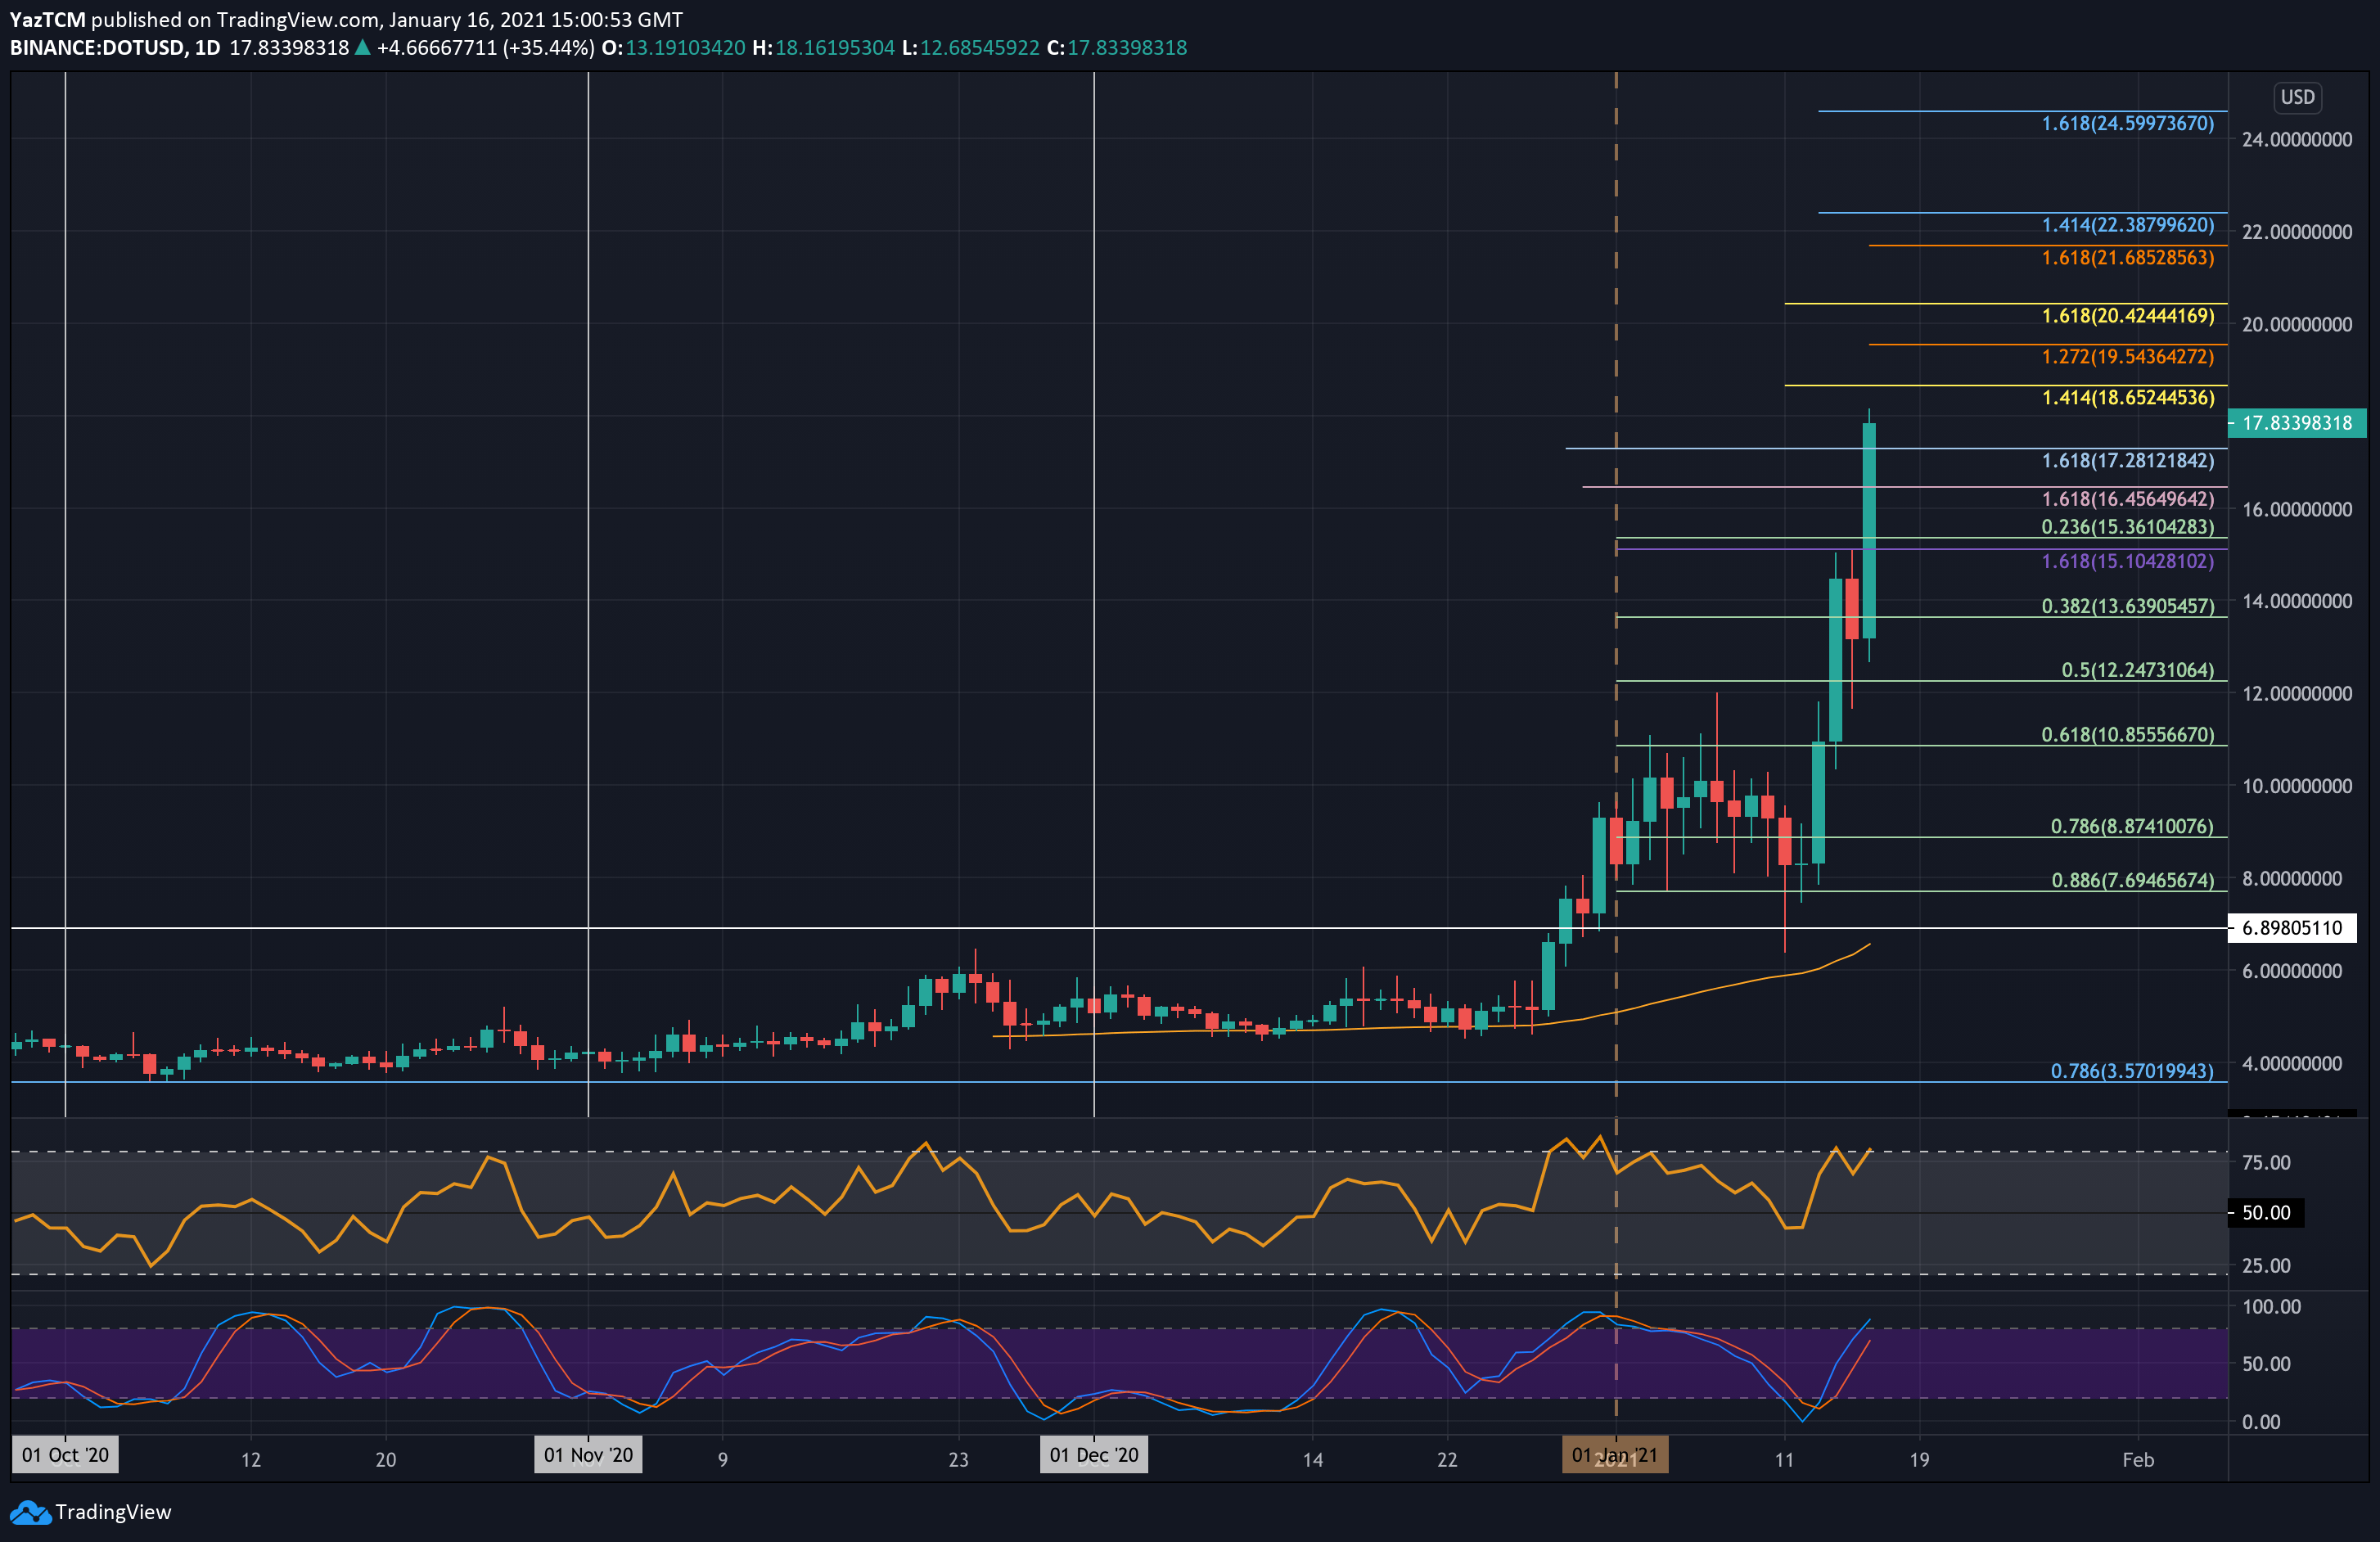
DOT/USD Daily Chart. Source: TradingView
Key Support Levels: $17.30, $16, $15.35.
Key Resistance Levels: $18.15, $18.65, $19.55.
Today, DOT surged by 30.5% to set a new ATH price at $18.15. The cryptocurrency is now up by a total of 88% this week after bouncing from support at $8 on Wednesday. From there, it continued higher until it hit resistance at $15.10 (1.618 Fib Extension) on Thursday.
It stalled at this resistance yesterday, but today’s 30.5% price surge allowed it to break beyond $15.10 as it surged higher to break resistance at $16.45 and reach a new ATH at $18.15. It has since pulled back to trade around $17.80.
Looking ahead, if the bulls break the ATh at $18.15, the first level of resistance lies at $18.65 (1.414 Fib Extension – yellow). This is followed by $19.55 (short term 1.272 Fib Extension), $20, and $20.43.
Additional resistance is found at $21.65, $22.40, and $24.60.
On the other side, the first level of support lies at $17.30. This is followed by $16, $15.35 (.236 Fib Retracement), $15.10, and $13.64 (.382 Fib Retracement).
The RSI is reaching overbought conditions but still has toom to push higher before becoming extremely overbought.
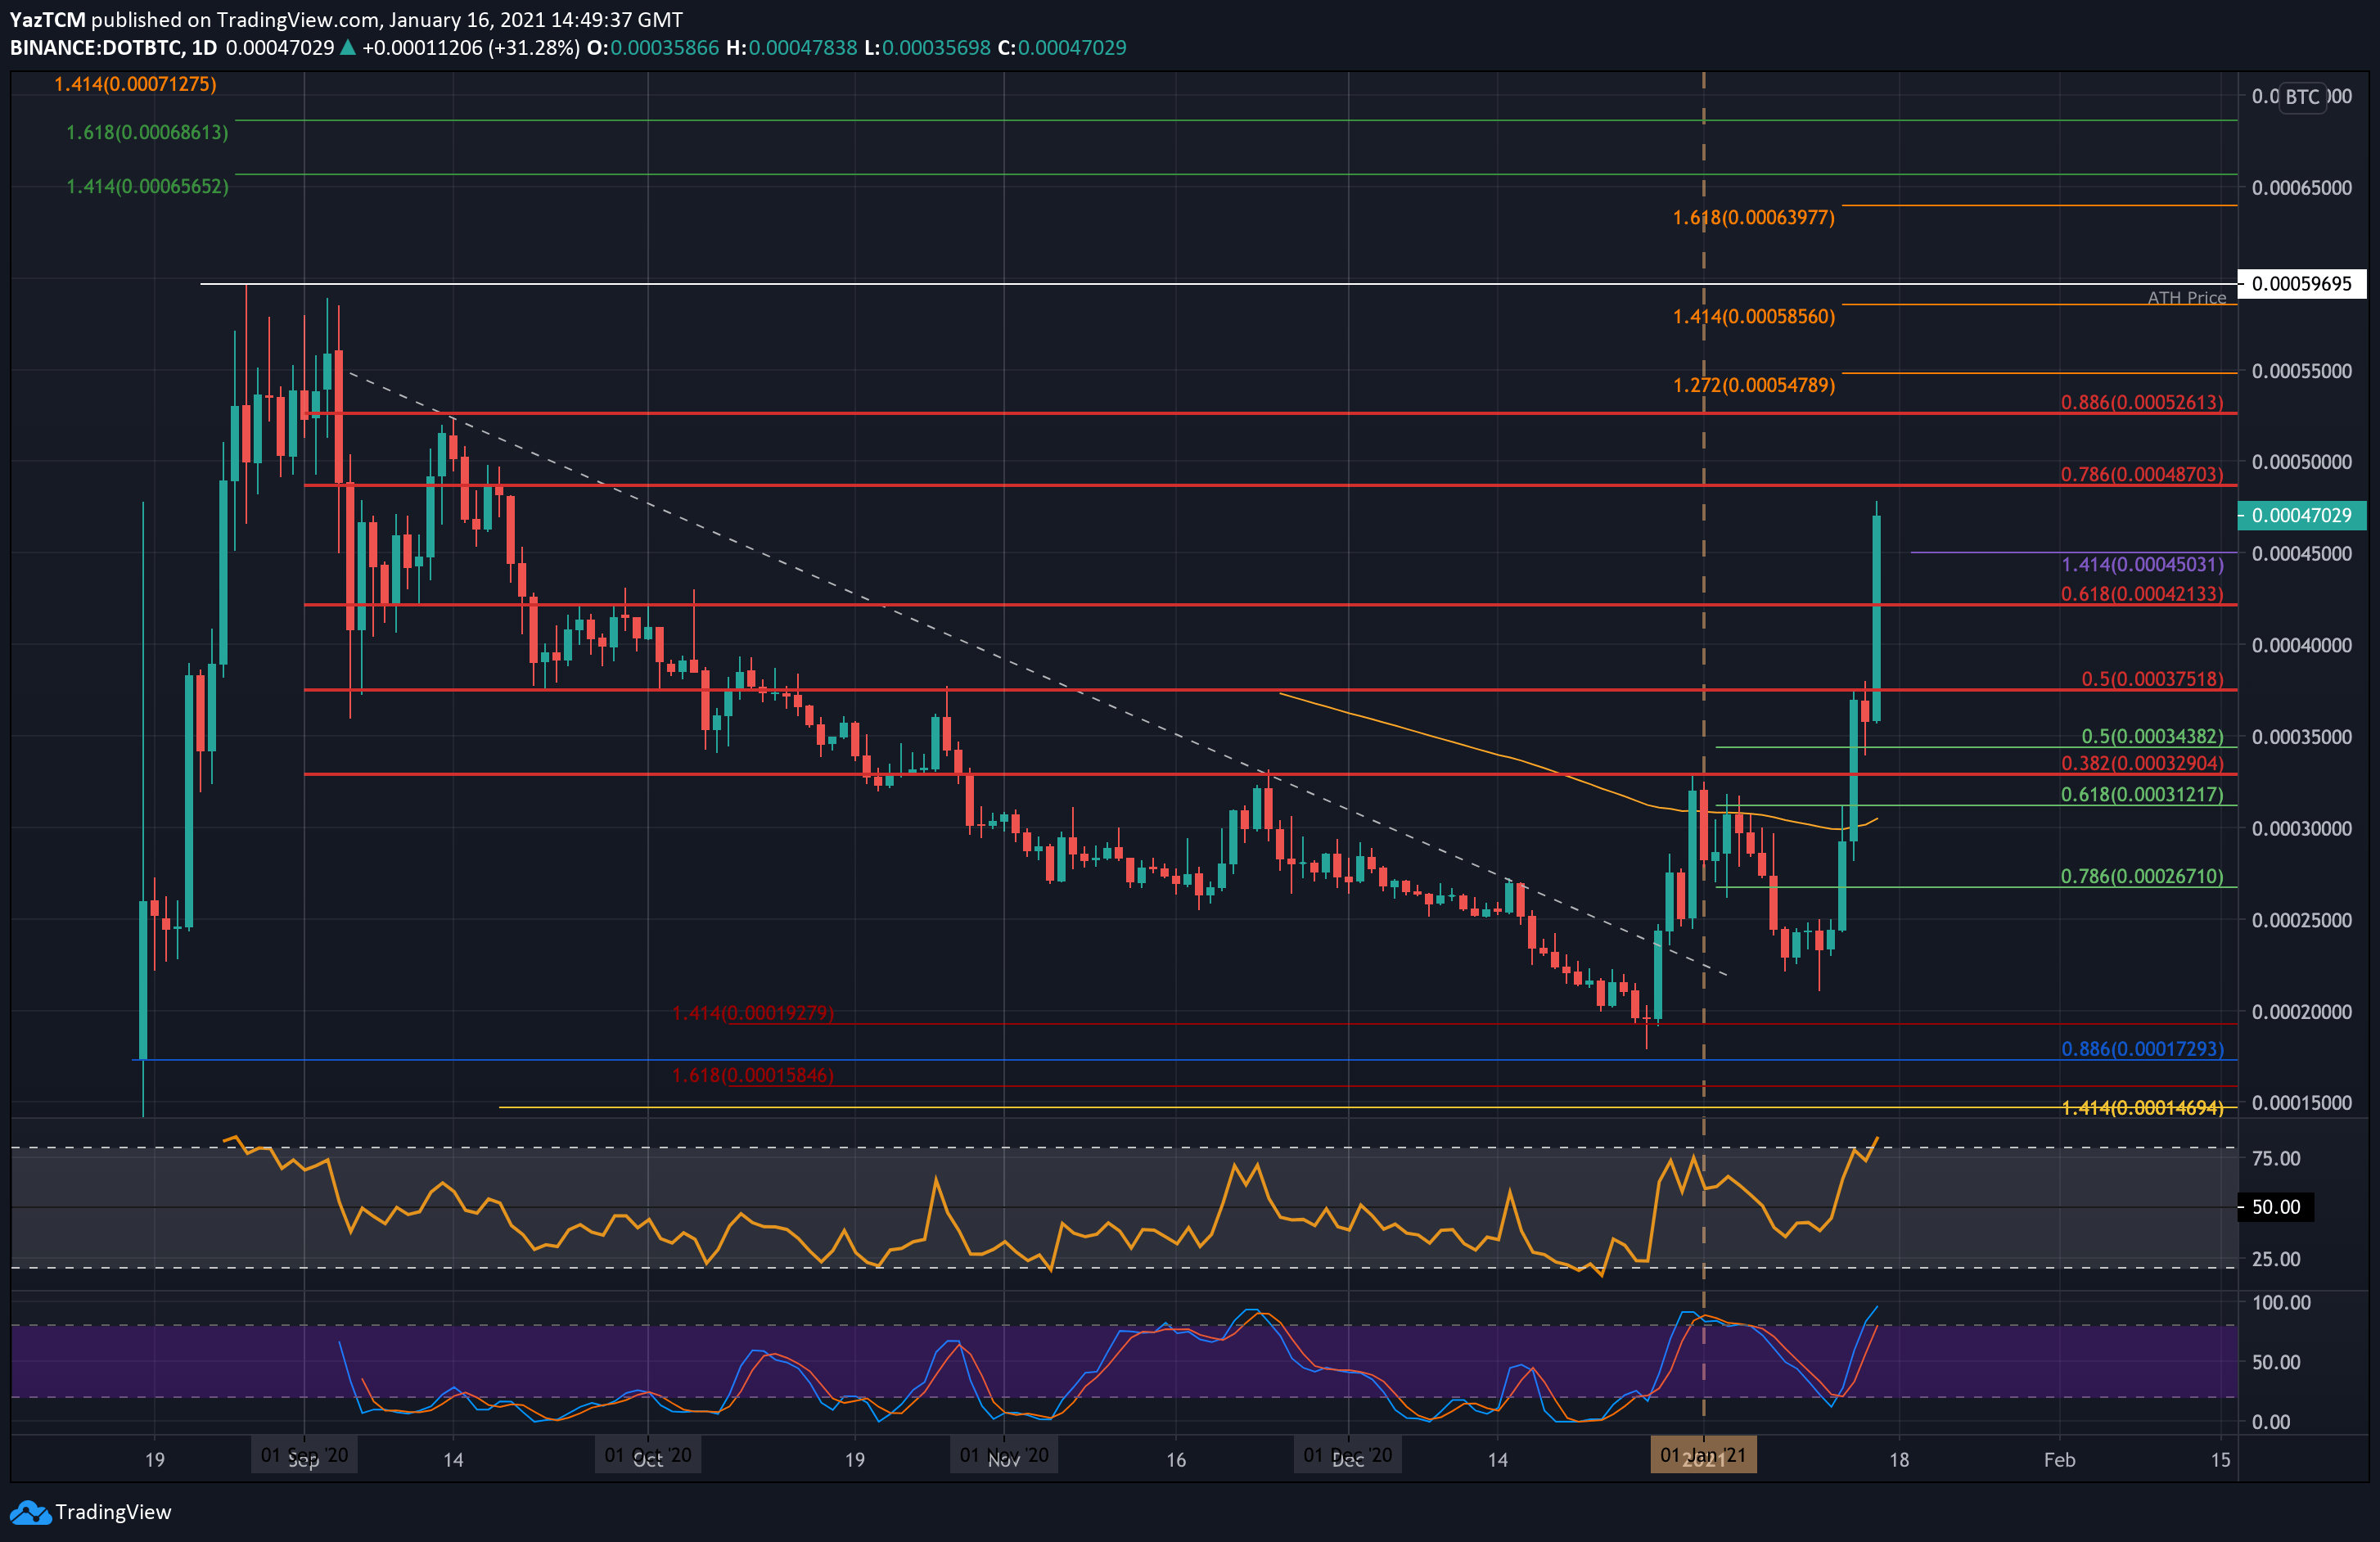
Key Support Levels: 45,000 SAT, 42,000 SAT, 40,000 SAT.
Key Resistance Levels: 48,700 SAT, 50,000 SAT, 52,600 SAT.
Against Bitcoin, DOT is also moving higher this week. It had pushed above 25,000 SAT and continued higher to reach the resistance at 37,500 SAT (bearish .5 Fib Retracement) on Thursday.
It struggled at this resistance yesterday, but the bullish price surge allowed it to penetrate above 40,000 SAT today to reach the current 47,000 SAT level.
Looking ahead, if the buyers continue upward, the first level of resistance lies at 48,700 SAT (bearish .786 Fib Retracement). This is followed by 50,000 SAT, 52,600 SAT (bearish .886 Fib Retracement), and 55,000 SAT (1.272 Fib Extension).
On the other side, the first level of support lies at 45,000 SAT. This is followed by 42,000 SAT, 40,000 SAT, and 37,500 SAT.
The Daily RSI is already extremely overbought, indicating the buyers might be a little overextended. It is the highest level the indicator has printed since coming onto the open market.