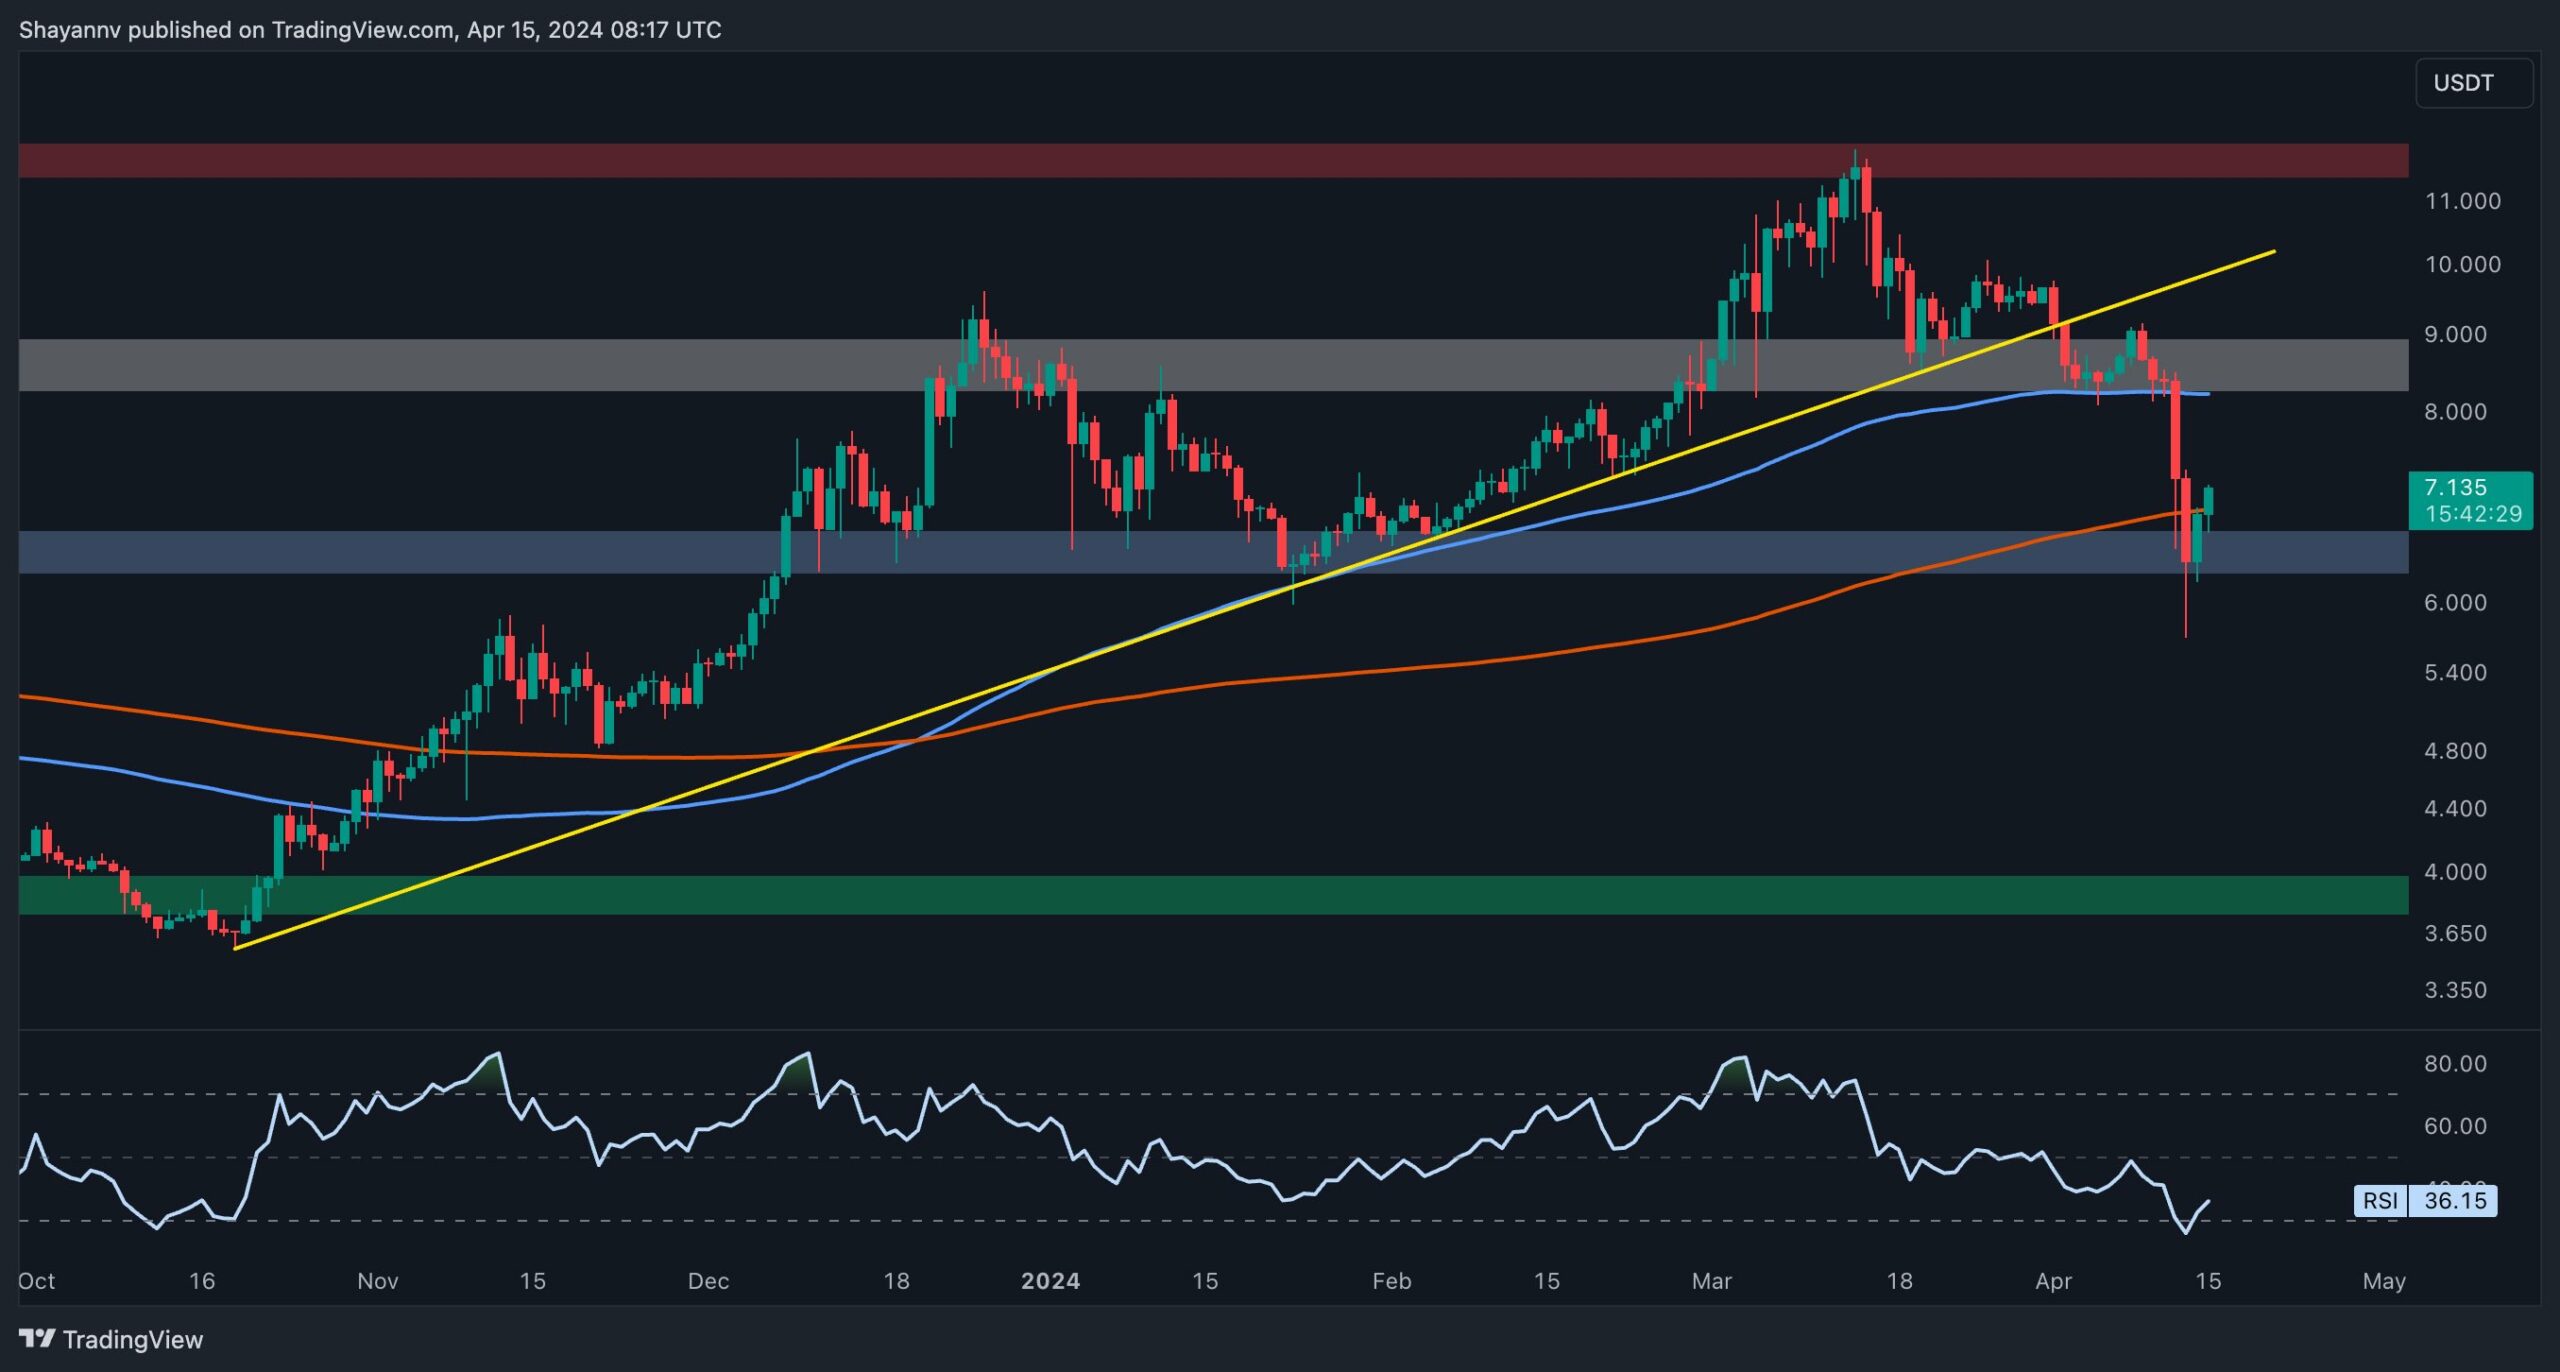
Polkadot’s price has recently undergone a significant 33% decline triggered by news of the Iran-Israel conflict on April 14th. However, the price found support at the crucial 200-day moving average, suggesting a potential period of consolidation correction.
By Shayan
A detailed review of the daily chart reveals a substantial downtrend, with Polkadot experiencing a 32% decline following the recent concerning news of Iran invading Israel on April 14th.
This plunge breached several critical support levels and triggered a significant long-squeeze event in the perpetual markets, resulting in the liquidation of numerous long positions.
In other words, the recent plunge triggered a cascade of sell-stop orders, intensifying selling activity in the market. Nonetheless, the DOT price ultimately found support at the crucial 200-day moving average, currently at $6.9, and exhibited a slight rebound.
The most likely outcome going forward is for the cryptocurrency to enter a consolidation stage within the pivotal price range, spanning from the dynamic support of the 200-day moving average to the crucial resistance at $9 in the medium term.
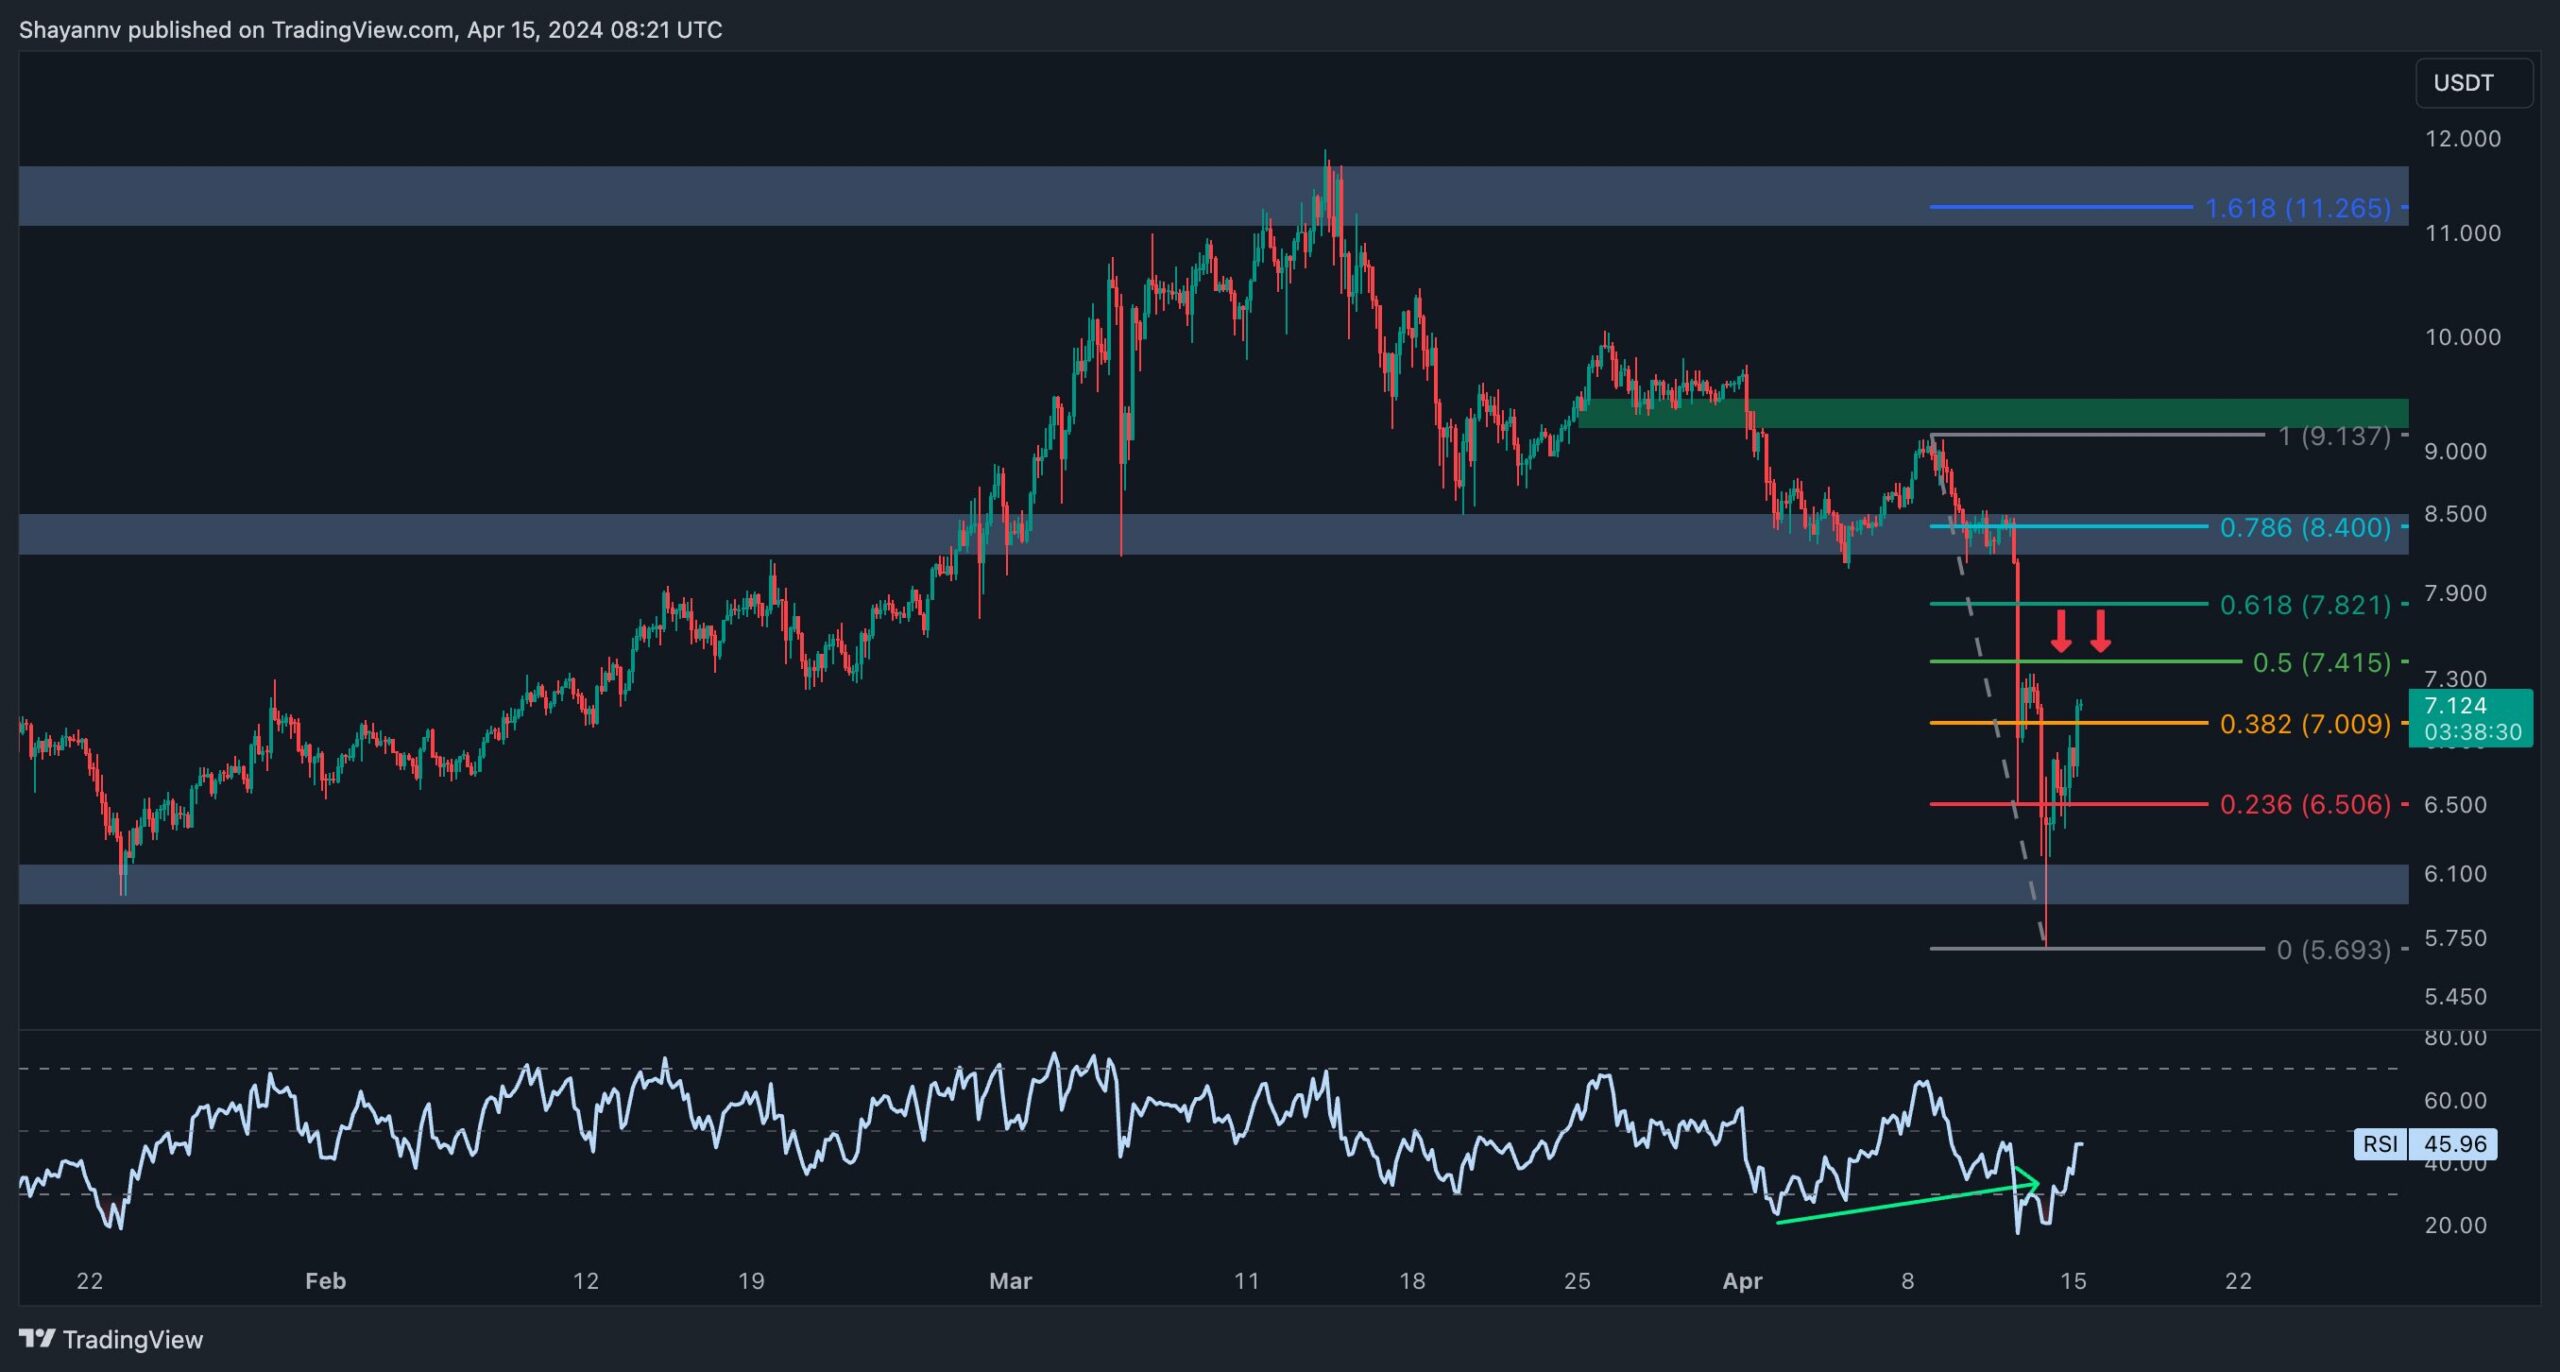
A comprehensive Polkadot price analysis of the 4-hour timeframe indicates that following an unsuccessful attempt to breach the $9 resistance region, DOT encountered heightened selling pressure, leading to a substantial decline.
The breach of the critical $8 support zone acted as a catalyst for this downturn, driving the price toward the significant $6 support level.
However, the cryptocurrency exhibited a minor bullish reversal upon reaching the crucial $6 support zone, indicating the presence of demand at this level.
Nevertheless, Polkadot is expected to continue its corrective movement, with the next target lying within the price range between the 0.5 ($7.4) and 0.618 ($7.8) Fibonacci levels.
By Shayan
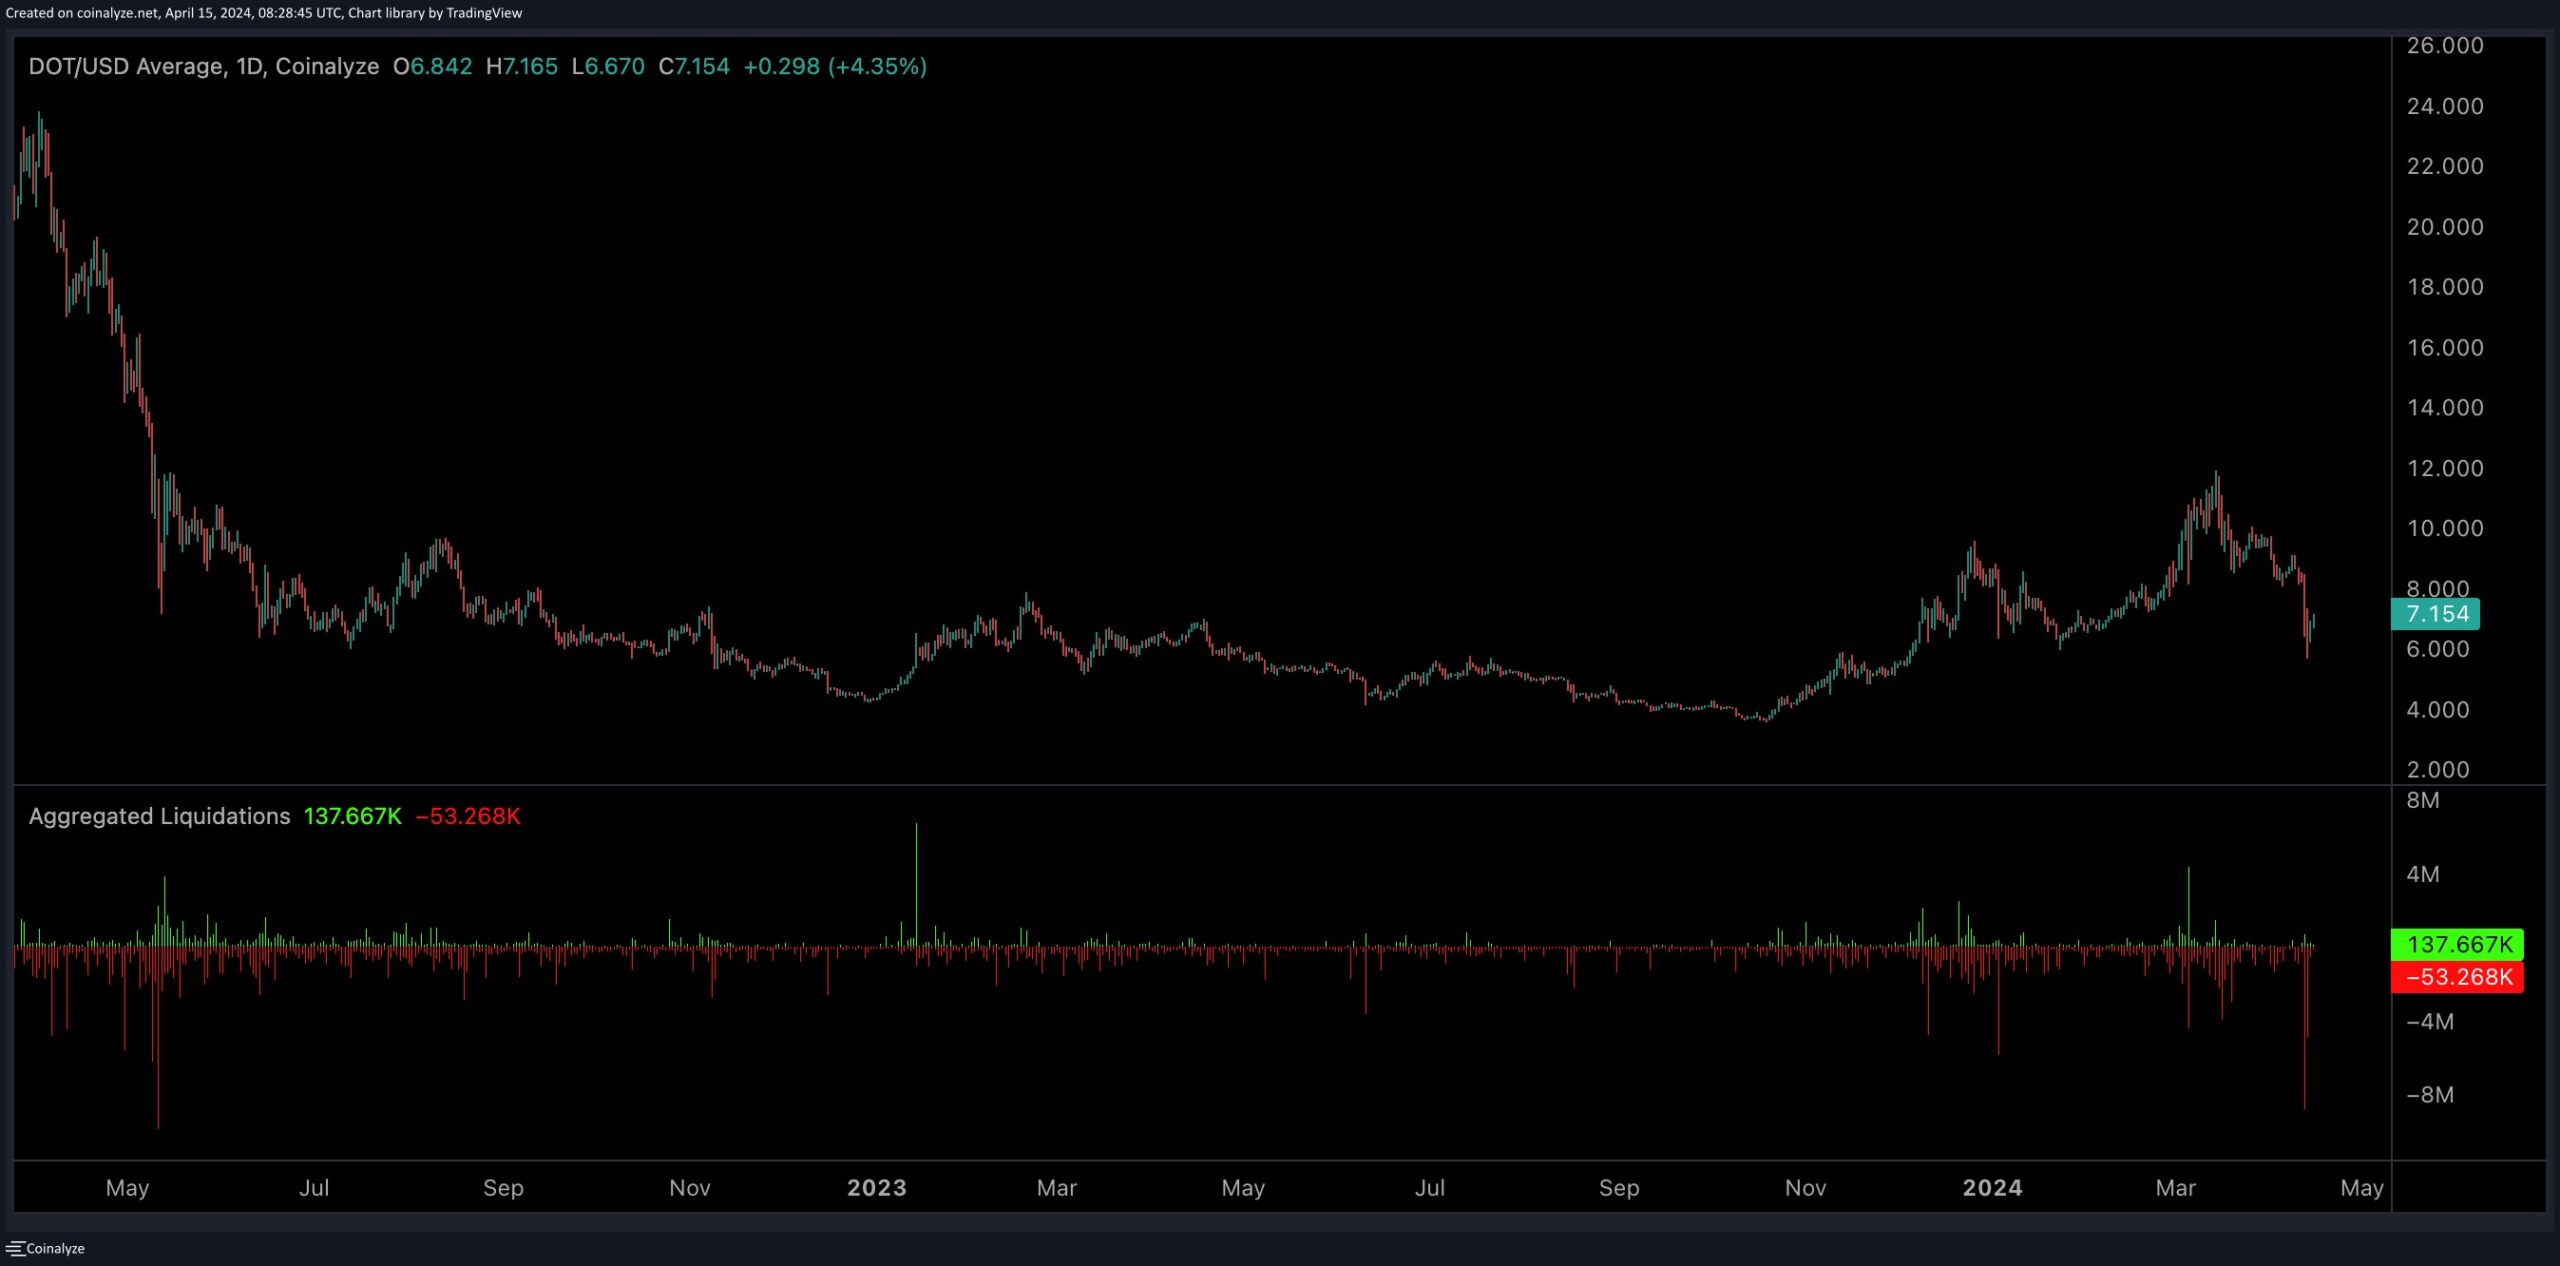
On April 14th, Polkadot underwent a significant downturn sparked by the escalating conflict between Iran and Israel.
The geopolitical tension seriously affected traders and instilled worries regarding heightened volatility and potential price declines. The sudden surge in volatility directly impacted traders engaged in perpetual futures contracts, resulting in the forced liquidation of long positions totaling approximately US$14 million.
Notably, this recent event marked the most significant long liquidation occurrence since May 2022. Consequently, the futures market appears to have cooled down, paving the way for a potential bullish rebound toward higher price thresholds.
However, these developments are a stark reminder of the market’s susceptibility to large-volume trades, mainly when influenced by major news events.
This post has been powered by Polkadot.