DOT/USD Daily Chart. Source: TradingView.
Key Support Levels: $35.30, $32.55, $30.
Key Resistance Levels: $38.65, $40, $42.10.
DOT surged above resistance at $30 toward the end of August as it started to climb higher in the first week of September to reach resistance at $35.30 (bearish .618 Fib). However, it could not overcome this level and ended up falling into the 200-day MA around $27.50 during the market crash last week.
Since then, DOT solidified the support at the 200-day MA and started to climb higher again. On Sunday, it surged above $35.30 and closed over the resistance. After a brief retracement to $32.50 yesterday, DOT has finally surged well above $35.30 to reach near $38 today.
Looking ahead, the first resistance lies at $38.65 (1.618 Fib Extension). This is followed by $40, $42.10 (bearish .786 Fib), $44 (1.272 Fib Extension), and $46.15 (bearish .886 Fib Retracement).
On the other side, the first support lies at $35.30. This is followed by $32.55 (.236 Fib), $30, and $28.30 (.382 Fib & 200-day MA).
The RSI is rising, indicating that the bullish momentum is increasing. It is also not overbought, meaning there is room for the buying to continue.
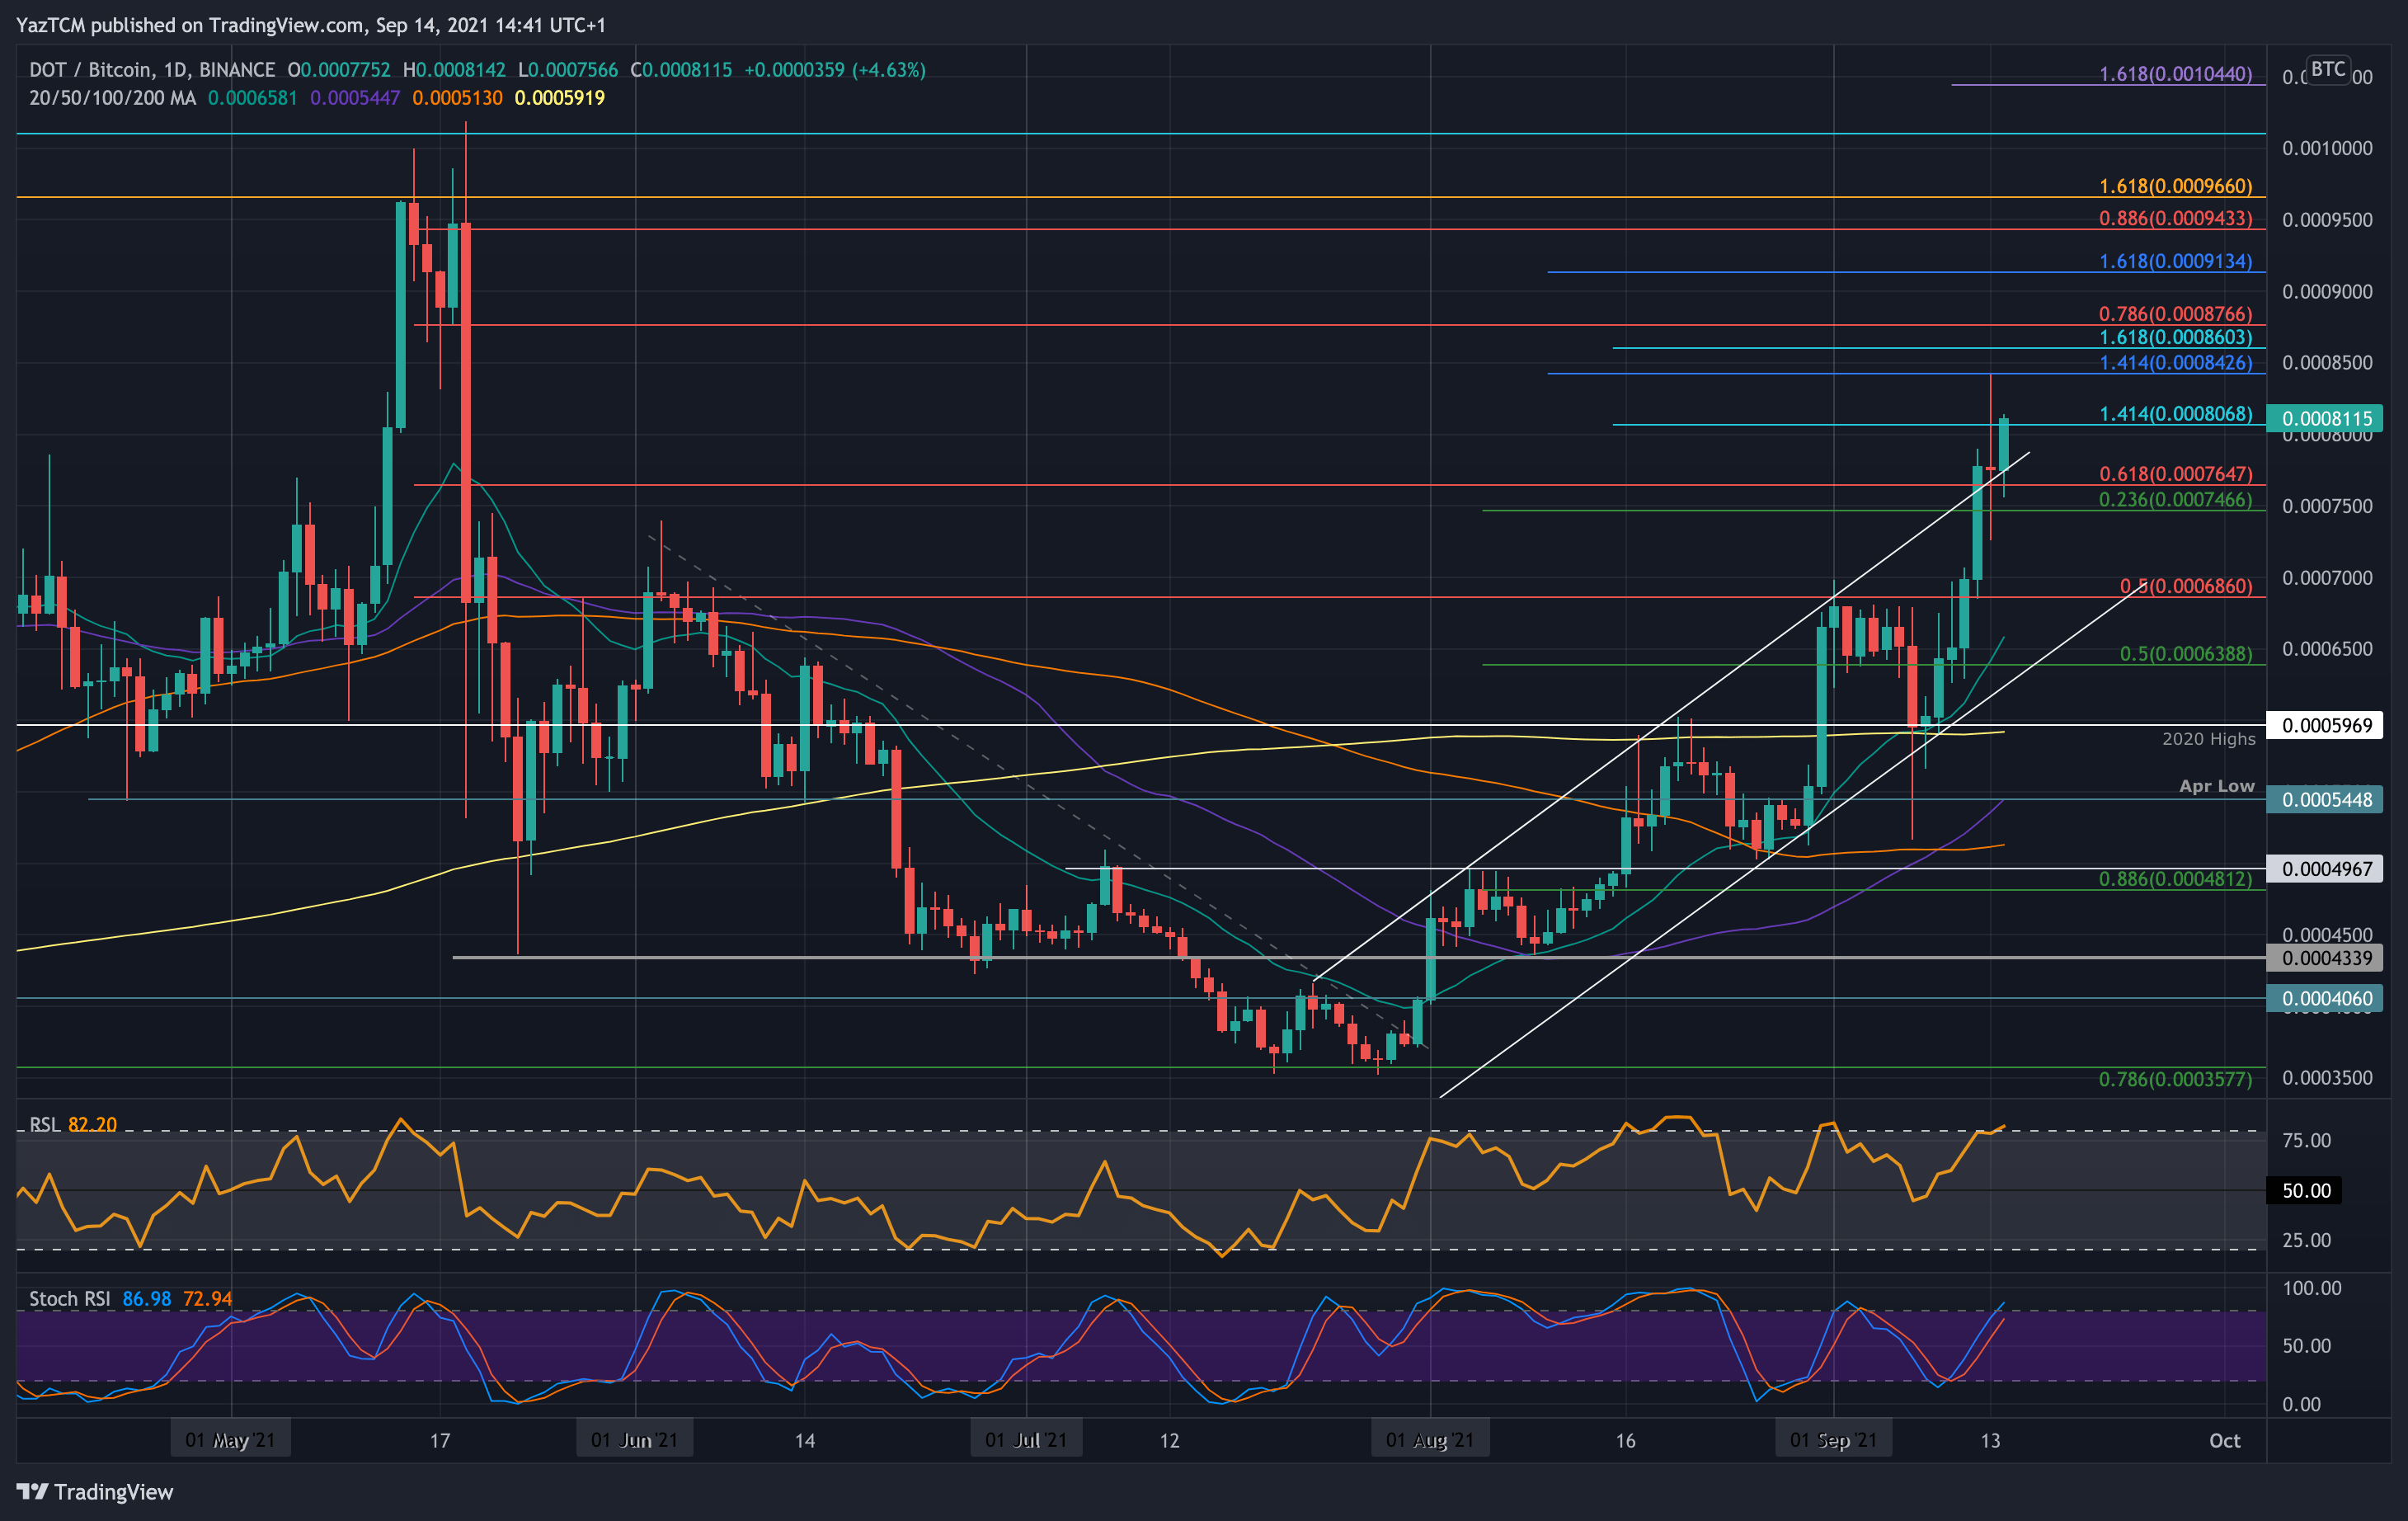
Key Support Levels: 0.0007465 BTC, 0.0007 BTC, 0.0009 BTC.
Key Resistance Levels: 0.00085 BTC, 0.0008765 BTC, 0.0009 BTC.
DOT is also performing well against BTC after turning parabolic by breaking above an ascending price channel. It has been trading inside this price channel since establishing support around 0.00035 BTC toward the end of July.
It surged inside the price channel in August to initially reach a high of 0.0006 BTC. By the start of September, DOT had reached as high as 0.0006860 BTC (bearish .5 Fib). This resistance was broken over the weekend as the cryptocurrency poked above the price channel for the first time on Monday. Today, it continued above the price channel to break 0.00081 BTC.
Looking ahead, if the buyers continue upward, the first resistance lies at 0.00085 BTC. This is followed by 0.0008765 BTC (bearish .786 Fib), 0.0009 BTC, 0.000943 BTC (bearish .886 Fib), and 0.0001 BTC.
On the other side, the first support lies at the ascending price channel. This is followed by 0.0007465 BTC (.236 Fib), 0.0007 BTC, 0.000686 BTC, and 0.000639 BTC (.5 Fib).
The RSI is near extremely overbought conditions, indicating the buyers might be a little overextended.