Ripple has seen a small price decline of 2% over the past 24 hours of trading, decreasing the current trading price of XRP down to $0.315.
The recent price drop got Ripple price to fall underneath the 2-month ascending trend-line formation which we have been following in our recent Ripple analysis.
So far 2019 has been declared as an Altcoin Season. However, Ripple is left outside the party as the major crypto had recorded a total of 12% losses over the past 90 days.
Despite the above, Ripple remains ranked in the third position of the leading cryptos by market cap, as it presently holds a $13 billion market cap value.
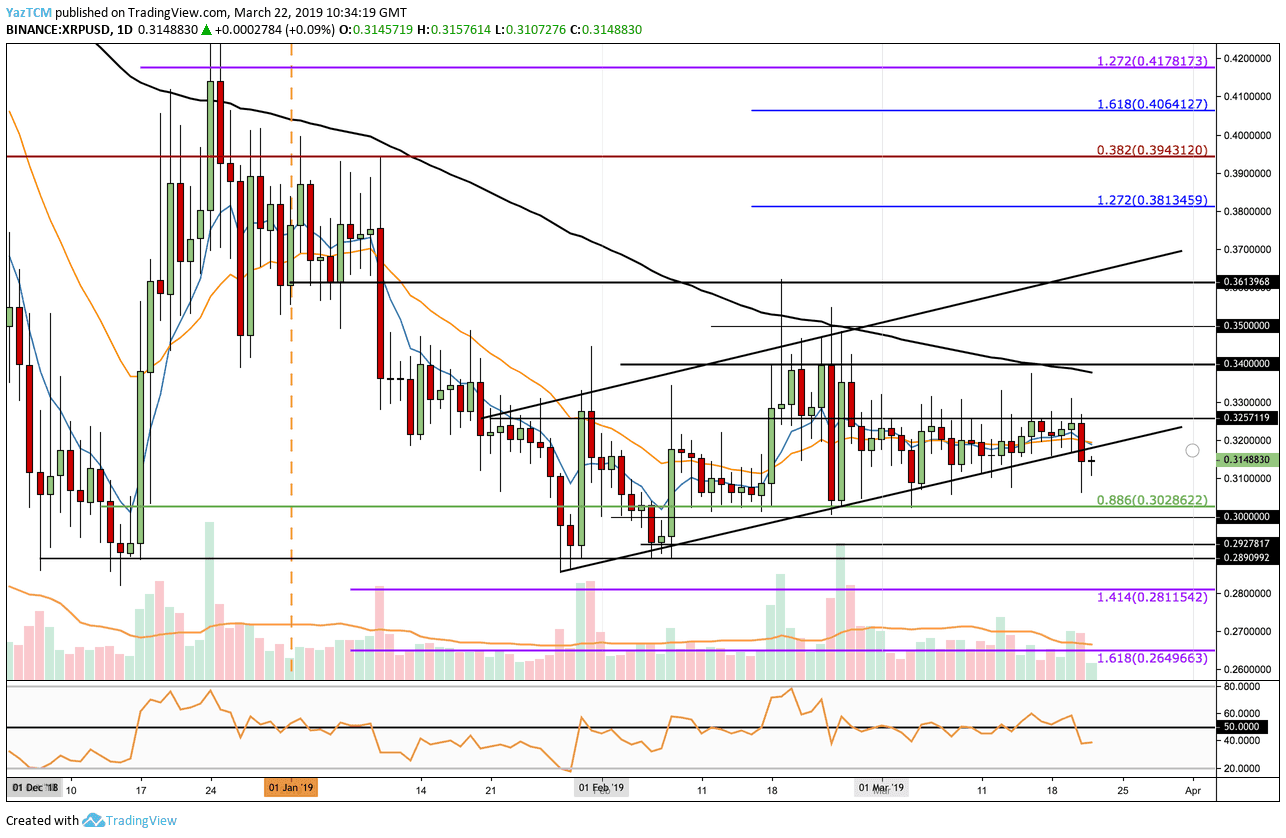
Looking at the XRP/USD 1-Day Chart:
- Since our last Ripple analysis, we can see that the market had continued to trade along the lower boundary of the ascending price channel. However, the market had continued to struggle to break above the $0.3260 level and had failed to do so during the past three weeks. The recent price drop broke down the ascending price channel formation.
- From above: The nearest level of resistance now lies at the previous lower boundary of the price channel. Further above, resistance lies at $0.3260, $0.34 (bolstered by the 100-day moving average), $0.35 and $0.3613.
- From below: The nearest level of support now lies around the $0.31 mark, followed by the $0.30 levels. If the bears push XRP below $0.30, further support then lies at $0.292 followed by $0.28 where lies the medium termed downside 1.414 Fibonacci Extension level.
- The RSI has recently plummeted below the 50 levels to indicate that the bears are now in control of the market momentum.
- The trading volume has remained at the average volume during March 2019.
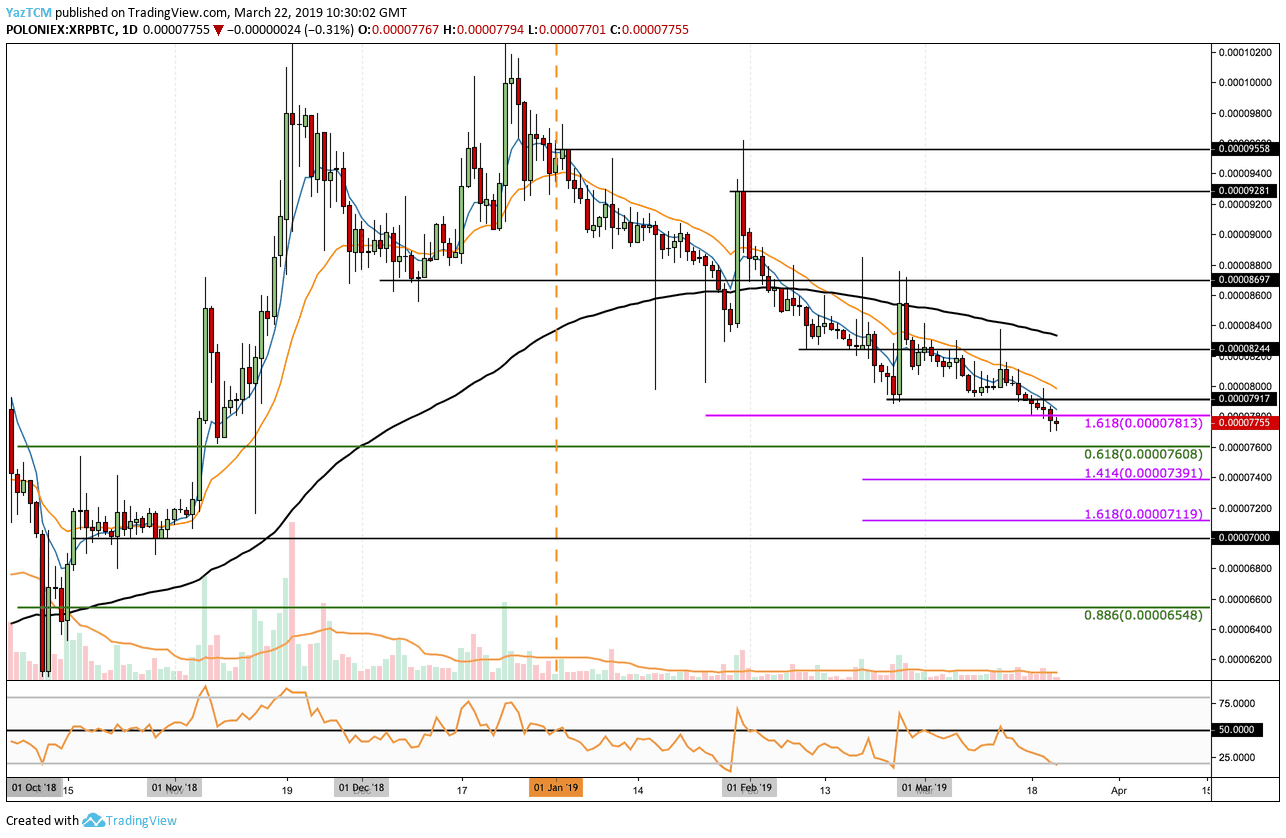
Looking at the XRP/BTC 1 Day Chart:
- Since our last XRP/BTC analysis, we can see that the coin has now slipped beneath our previously identified support at 7813 SAT. The market is currently trading at a price around 7755 SAT.
- From below: The nearest level of support now lies at 7608 SAT where lies the .618 Fibonacci Retracement level. Below, further support is expected at the short term downside 1.414 (7391 SAT) and 1.618 (7119 SAT) Fibonacci Extension level. If the sellers continue to push XRP below, support lies at 7000 SAT.
- From above: The nearest level of resistance now lies at 8000 SAT. Above this we can expect higher resistance around 8300 SAT where lies the 100-day moving average lines is.
- The RSI has also dropped significantly and has now approached oversold conditions. This may be an indication that the sellers may begin to run out of momentum in the near term.
- The trading volume remains low for XRP/BTC.
SPECIAL OFFER (Sponsored)
LIMITED OFFER 2024 for CryptoPotato readers at Bybit: Use this link to register and open a $500 BTC-USDT position on Bybit Exchange for free!
Disclaimer: Information found on CryptoPotato is those of writers quoted. It does not represent the opinions of CryptoPotato on whether to buy, sell, or hold any investments. You are advised to conduct your own research before making any investment decisions. Use provided information at your own risk. See Disclaimer for more information.
Cryptocurrency charts by TradingView.