Chart by TradingView
With volume disappearing and a weak attempt to move higher, MATIC’s momentum has shifted bearish.
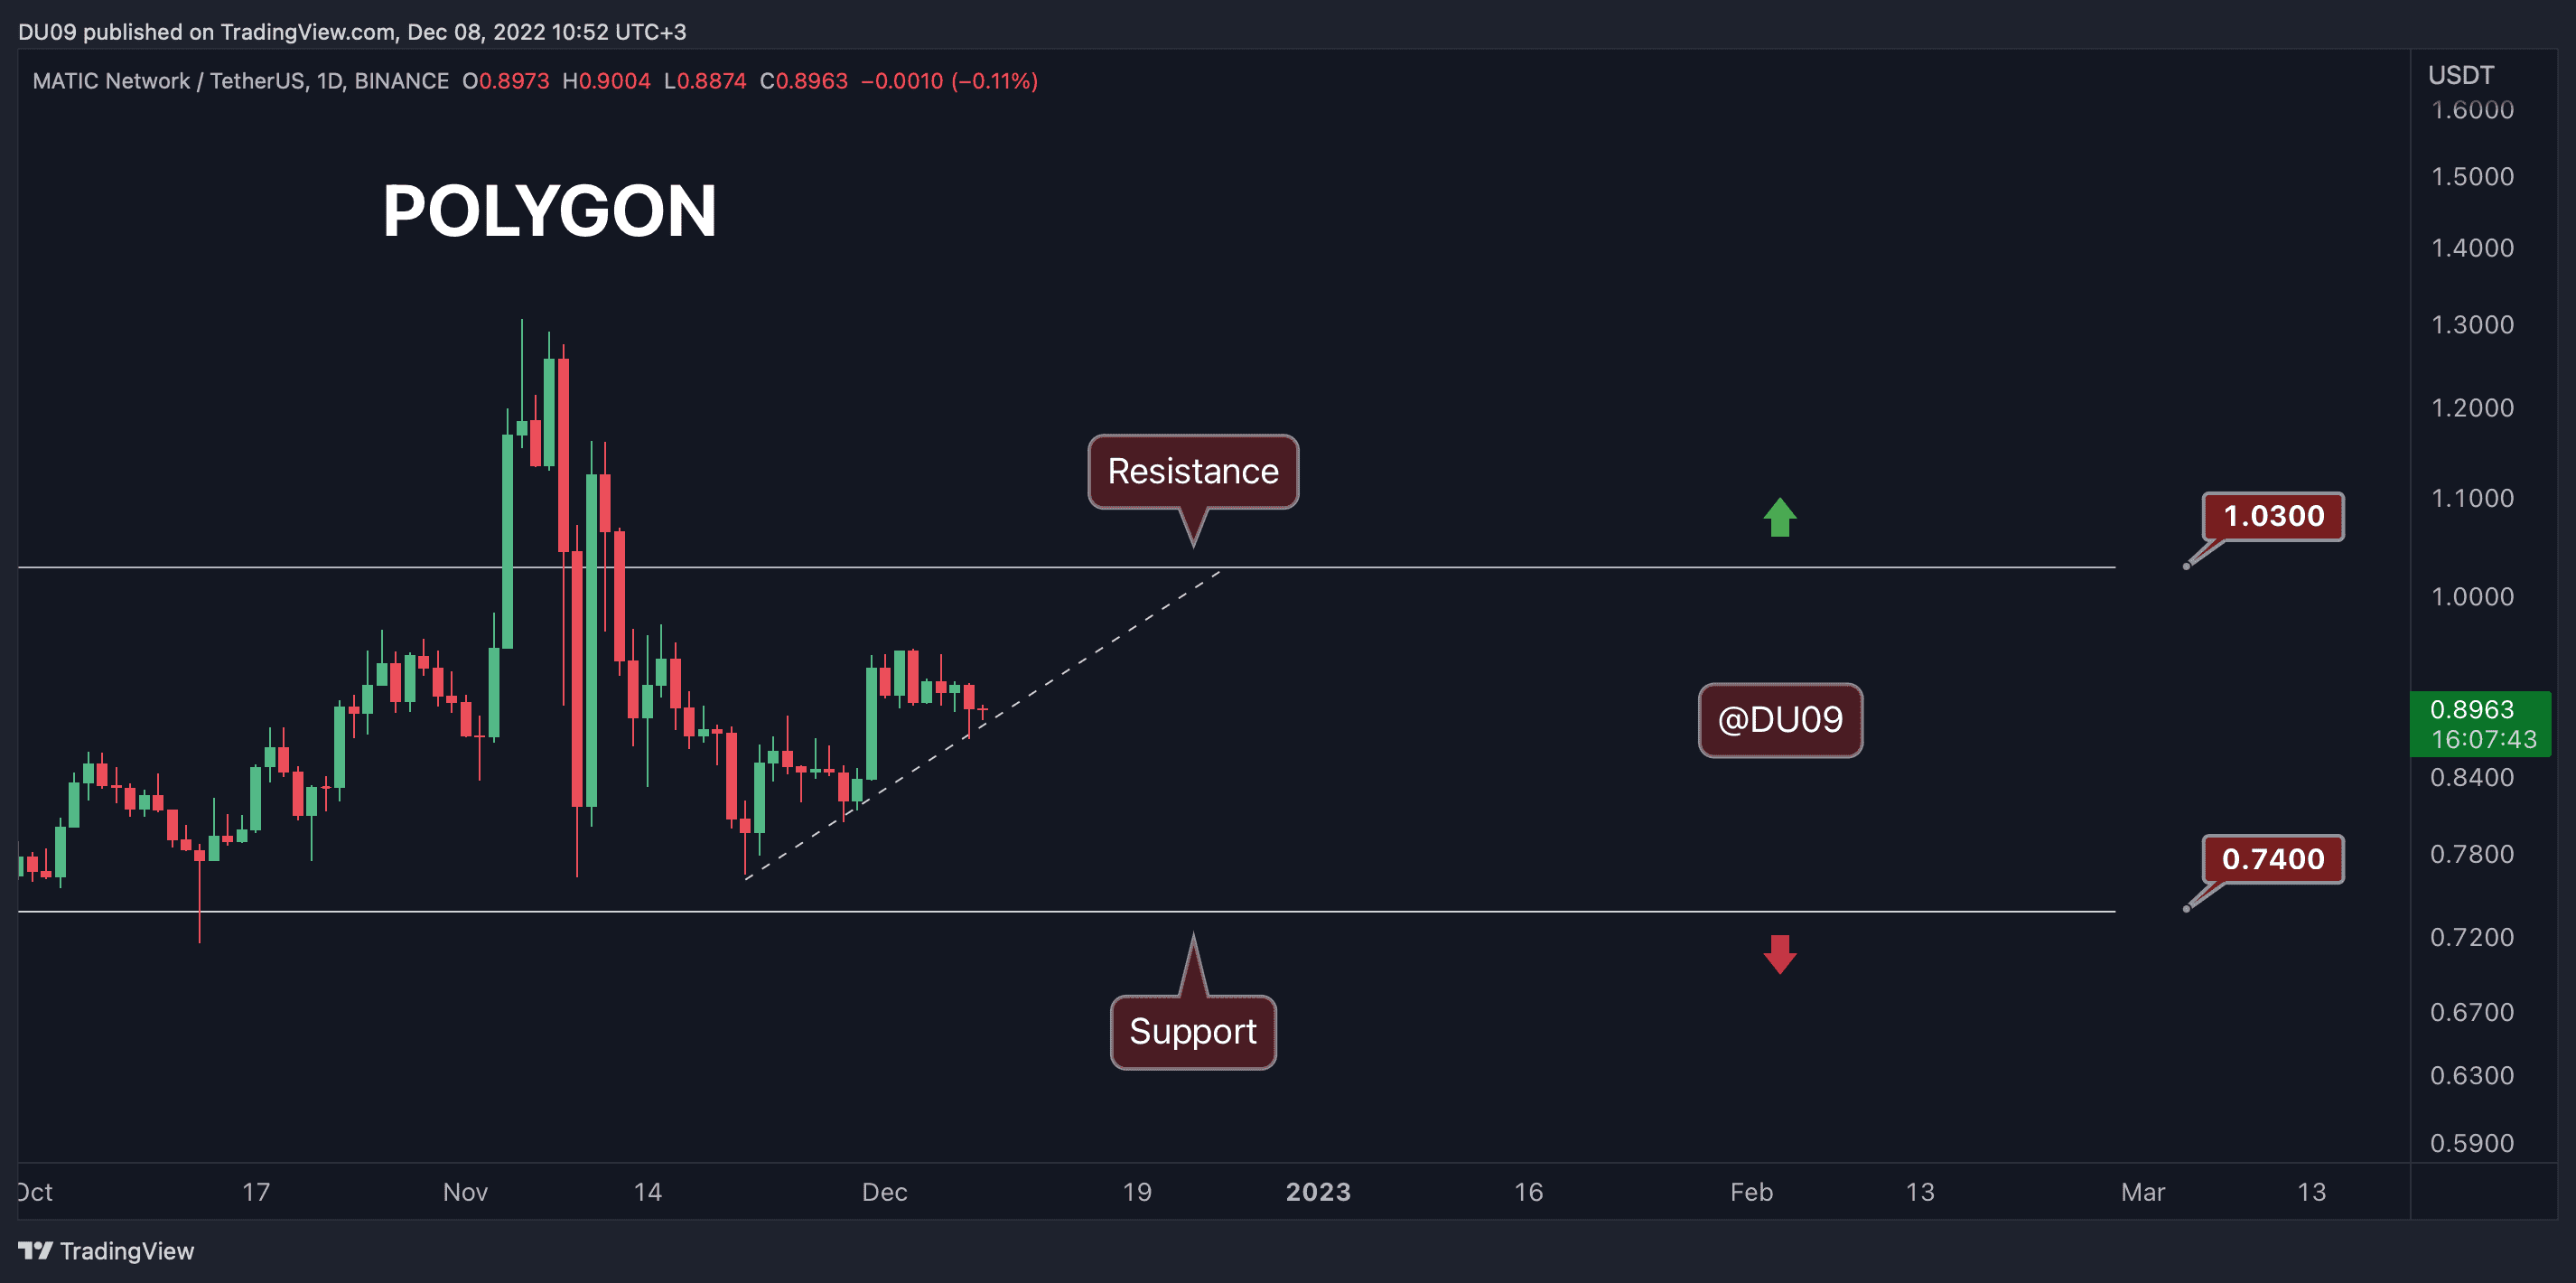
Key Support levels: $0.86, $0.74
Key Resistance levels: $1
MATIC’s price action is completing a head and shoulder formation, with the right shoulder being formed at the time of this post. This puts the price in a downtrend in the near term. For this reason, MATIC may soon test the support at $0.86 or even $0.74 if this formation holds true. The key support remains at the $1 psychological level.
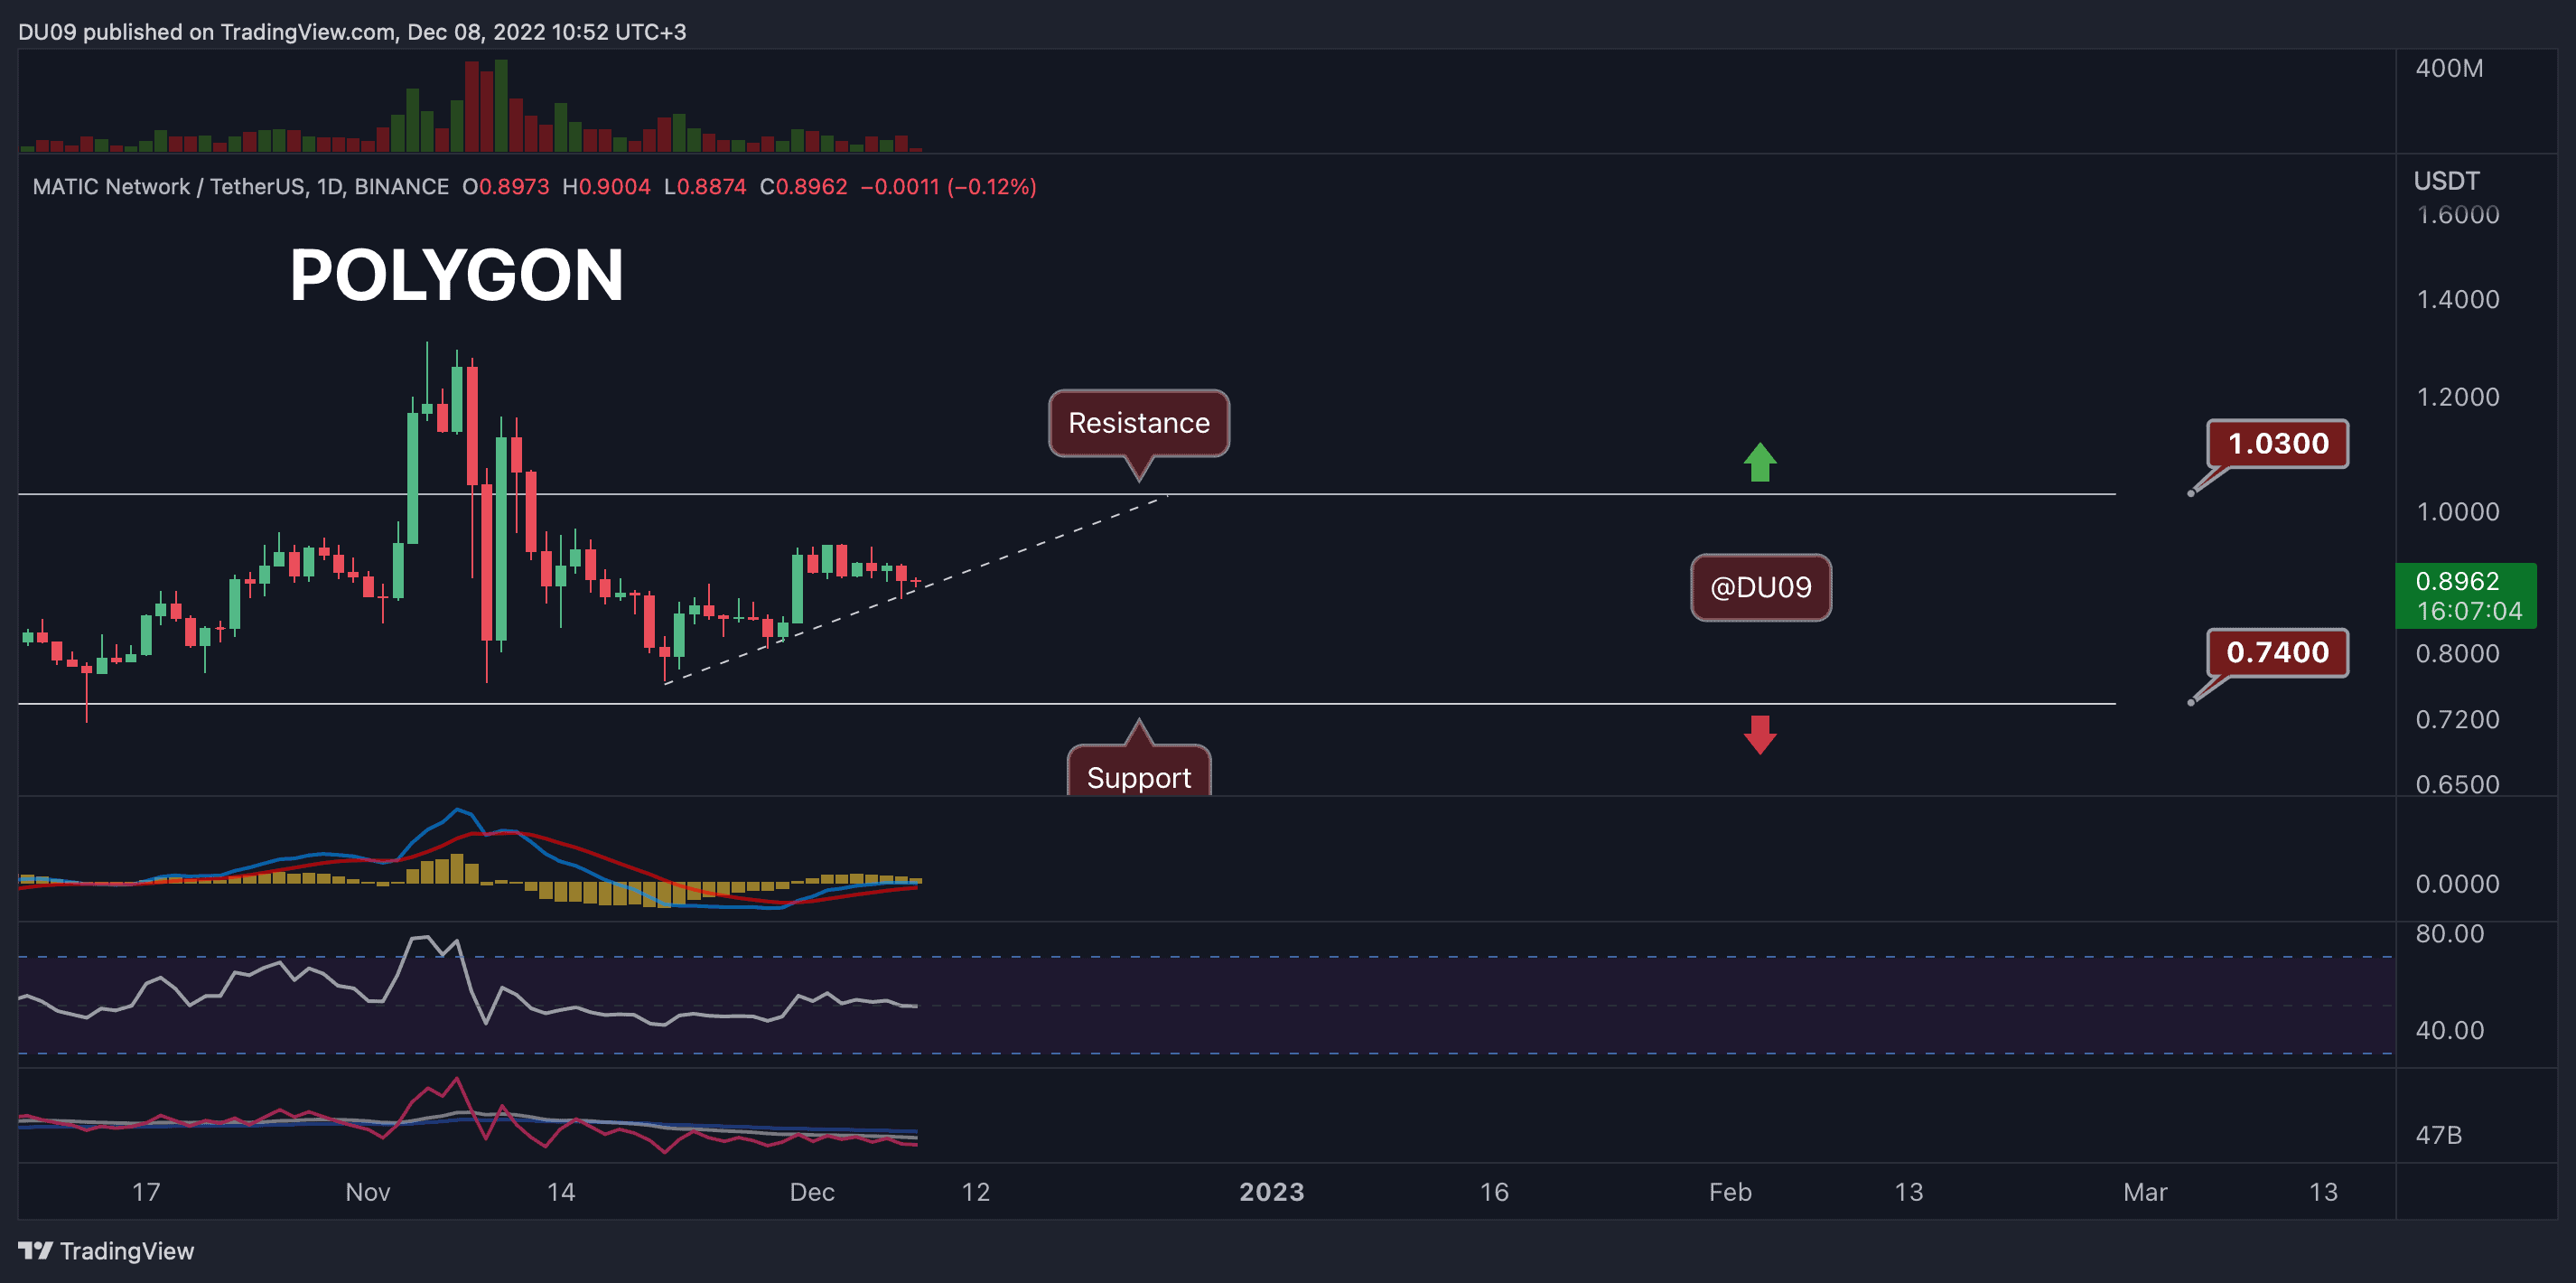
Trading Volume: The volume continues to fall, which shows weakness.
RSI: The daily RSI fell under 50 points. This is bearish.
MACD: The daily MACD remains bullish, but the histogram is making lower highs. If buyers don’t return, a bearish cross could follow next week.
The bias for MATIC is bearish.
MATIC holders do not have much to hang on to right now as the price action appears bearish, and they may need to wait for a retest of the key support at $0.86 before any hope of a reversal can take place. The momentum is seemingly favoring the sell side.