Liteocin has seen a 2.77% price hike over the past 24 hours which has allowed the price to rise to the $68 mark. The cryptocurrency seems to be recovering after increasing by a total of 5.5% this week. However, Litecoin still has a long way ahead to gain back some of the 42% it lost over the past 3 trading months. Furthermore, LTC is struggling significantly against Bitcoin after dropping by 65% from the high in June 2019.
Litecoin remains the fifth-largest cryptocurrency with a market cap of $4.27 billion.
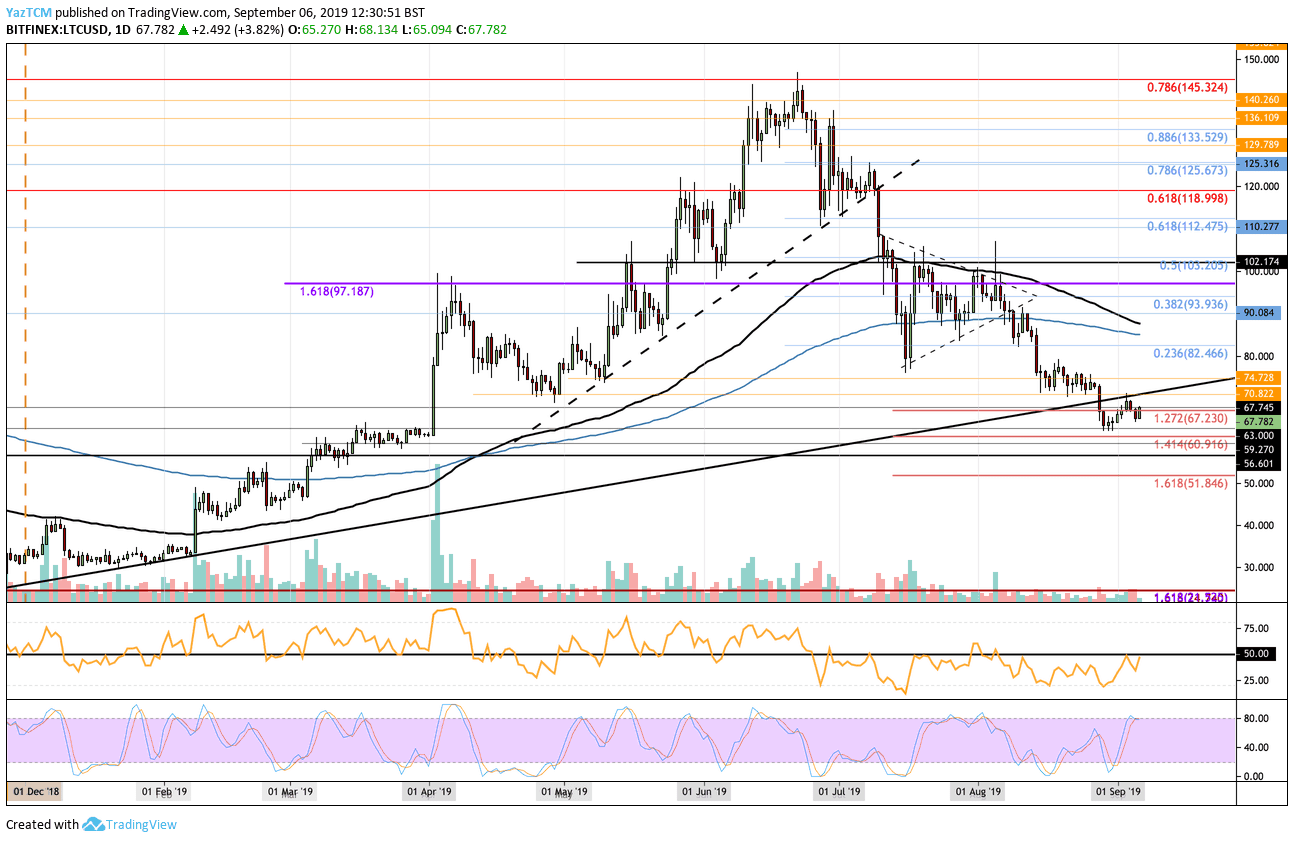
Looking at the LTC/USD 1-Day Chart:
- Since our previous Litecoin analysis, Litecoin has rebounded at our support around $63 which allowed the coin to rise back toward the previous rising support trend line. However, Litecoin was unable to penetrate above and was turned away. It seems Litecoin may be ready to make another re-test of this trend line over the coming days.
- From above: The nearest level of resistance lies at the $70.82 level which is strengthened by the rising trend line. Above the trend line, resistance lies at $74.72, $80, $82.46, $84.60 (200-days EMA), and $86.60 (100-days EMA). Further resistance is expected at $90, $93.93, $97.18, and $100.
- From below: The nearest level of support lies at $63. Beneath this, support is located at $60.91, $59.27, $56.60, $55, and $51.86.
- The trading volume has started to show some signs of a small increase.
- The RSI is testing the 50 level as the bulls attempt to regain momentum. If it can break above 50, we can expect the bullish push to cause LTC to travel higher. However, the Stochastic RSI is in a precarious position as it is poised for a bearish crossover signal which could send the market southward.
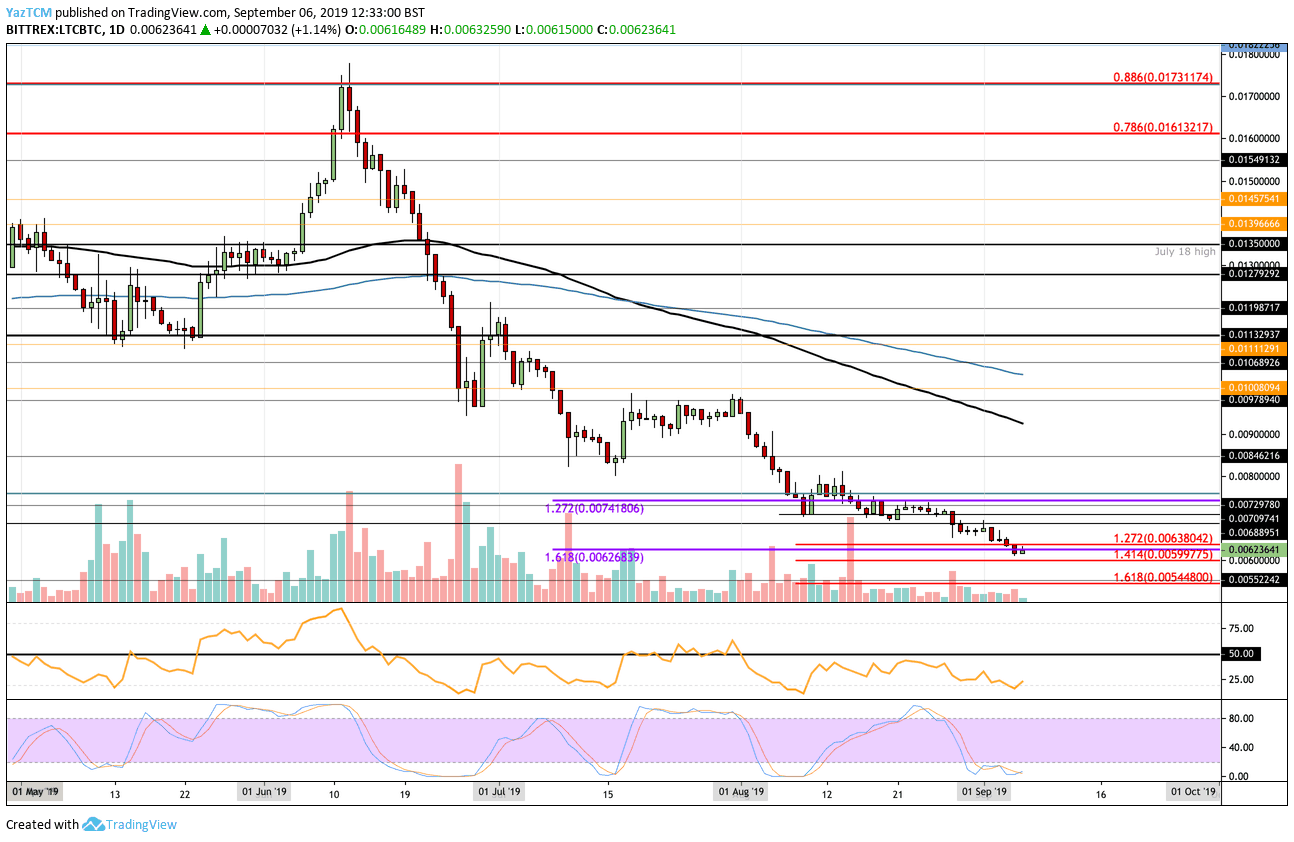
Looking at the LTC/BTC 1-Day Chart:
- Against Bitcoin, Litecoin has suffered heavily after already dropping by a total of 11% from the September high alone. LTC had nearly reached 0.006 BTC but had rebounded at support around 0.0061 BTC. The situation looks very bleak against BTC and we could potentially see some fresh multi-year lows incoming.
- From above: The nearest level of resistance lies at 0.0063 BTC and 0.0065 BTC. Above this, resistance is found at 0.0068 BTC, 0.0070 BTC, and 0.0072 BTC.
- From below: The nearest levels of strong resistance lie at 0.0062 BTC and 0.0060 BTC. Beneath this, support is located at 0.0058 BTC and at 0.00544 BTC (downside 1.618 Fibonacci Extension level).
- The trading volume remains lackluster and far beneath the average level.
- Both the RSI and Stochastic RSI are in oversold conditions. If they can show some signs of rising, this will be the first signal that the selling pressure is starting to fade.
SPECIAL OFFER (Sponsored)
LIMITED OFFER 2024 for CryptoPotato readers at Bybit: Use this link to register and open a $500 BTC-USDT position on Bybit Exchange for free!
Disclaimer: Information found on CryptoPotato is those of writers quoted. It does not represent the opinions of CryptoPotato on whether to buy, sell, or hold any investments. You are advised to conduct your own research before making any investment decisions. Use provided information at your own risk. See Disclaimer for more information.
Cryptocurrency charts by TradingView.