Litecoin’s price has experienced a promising increase of almost 12% over the past 24 hours, having surged back above the $100 level to $102.45. This bounce comes after a month in which Litecoin suffered a 25% reduction in price.
LTC remains the fourth largest cryptocurrency by market value, with a market cap of $6.35 billion. With the Litecoin block halving only 17 days away, we can expect this bounce to go much higher if it continues.
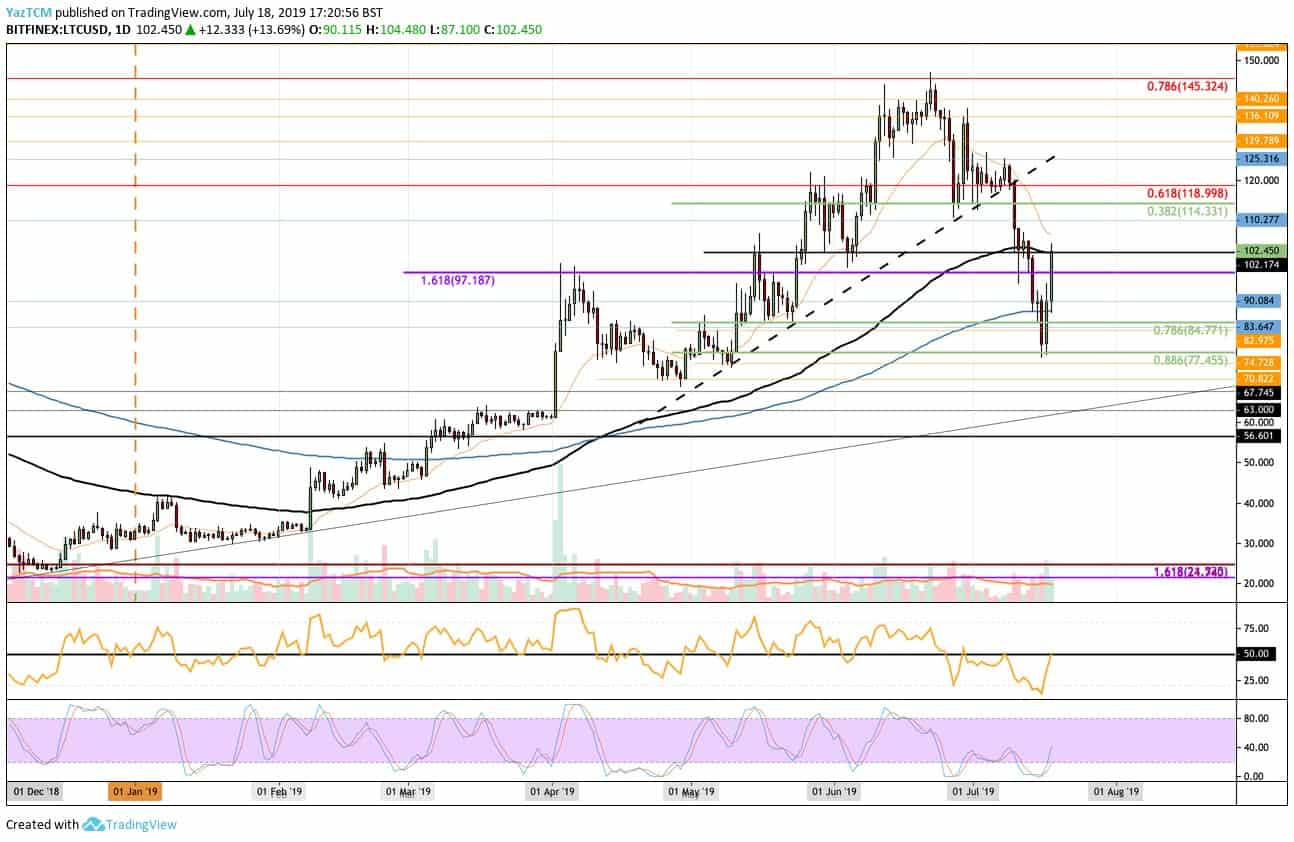
Looking at the LTC/USD 1-day chart:
- Since our previous Litecoin analysis, Litecoin has dropped beneath our highlighted support at the rising trend line. After breaking below this, Litecoin’s price fell heavily, dropping beneath both the 100- and 200-day EMAs to reach support at $77.45, which contains the short term .886 Fibonacci retracement level and is where the rebound occurred. The bounce caused LTC to sail back above the $100 level, and it’s currently testing the 100-day EMA.
- From above: The nearest level of resistance lies at the current $102 level as it contains the 100-day EMA. Above this, higher resistance lies at $110 and $118. If the buyers can climb above the $120 resistance, then further resistance lies at $125, $129, and $145. The resistance at $145 contains a bearish .786 Fibonacci retracement level that caused the market to reverse last month.
- From below: The nearest levels of support are $100, $95, $90, and $85 (contains the 200-day EMA). Below $85, further support lies at $80, $77, $74, and $70. If the sellers continue beneath $70, the next levels of support are $67, $63, $60, and $56.
- The trading volume rose to above average during the recent selloff and rebound.
- The Stochastic RSI recently produced a bullish crossover signal as we wait for the moving averages to diverge from one another. Furthermore, the RSI itself has approached 50 as we wait for a break above it to signal that the bulls are in control.
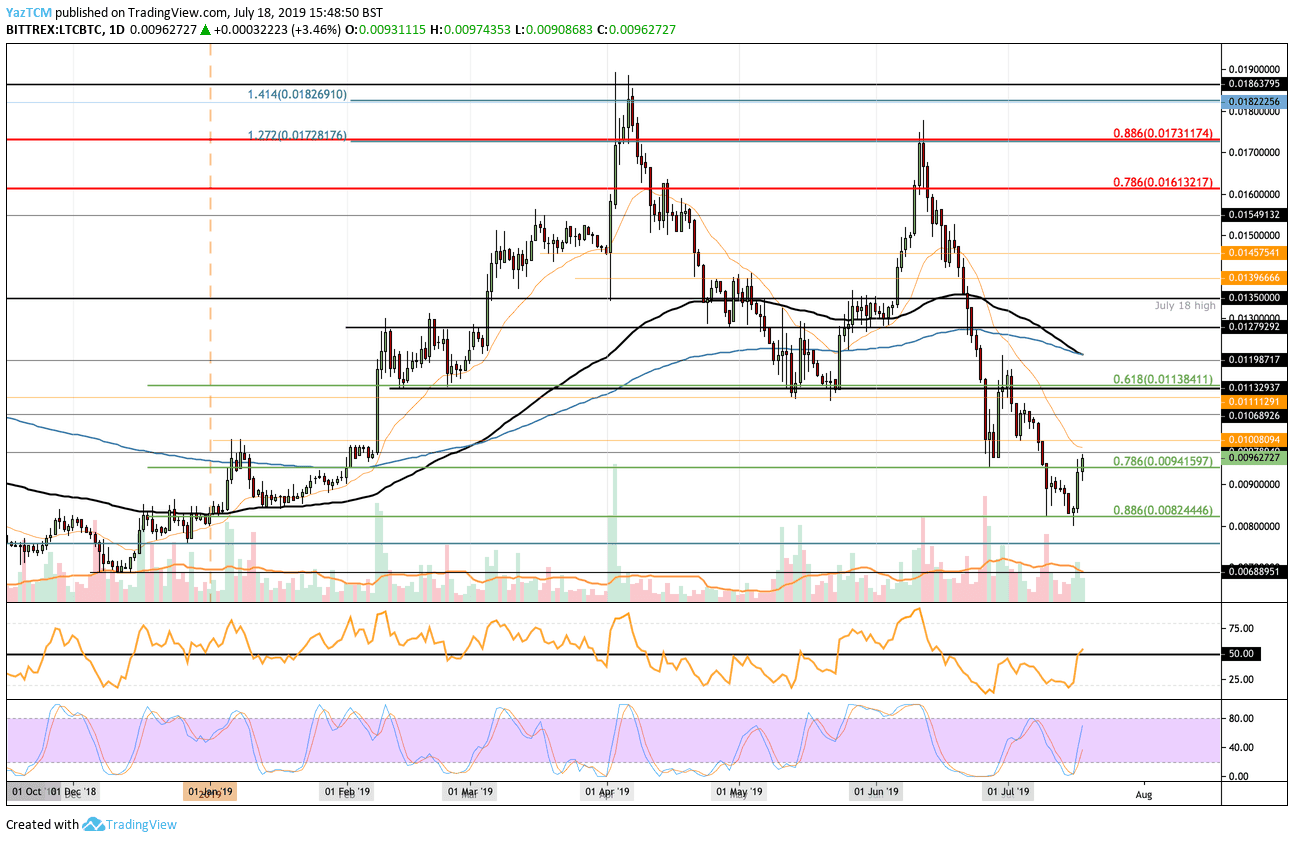
Looking at the LTC/BTC 1-day chart:
- Against Bitcoin, LTC has fallen lower beneath the support at 0.01 BTC. The LTC/BTC price dropped as low as 0.008244 BTC, which is support provided by the short-term .886 Fibonacci retracement level. LTC subsequently rebounded against BTC and now trades around 0.00962 BTC.
- From above: The nearest level of resistance lies at 0.01 BTC. Above this, the next levels of resistance are 0.0106 BTC, 0.01138 BTC, and 0.012 BTC (which contains the 100- and 200-day EMAs). If the bulls climb above 0.012 BTC, higher resistance lies at 0.013 BTC and 0.0135 BTC.
- From below: The nearest levels of support are 0.0094 BTC and 0.009 BTC. Beneath 0.009 BTC, further support lies at 0.0085 BTC and 0.008244 BTC. If the selling creates a fresh 2019 low, lower support is located at 0.0078 BTC and 0.0068 BTC.
- The trading volume has also spiked above the average over the past couple of days.
- The RSI has breached the 50 level which shows the bulls in control of the market, and the Stochastic RSI has produced a bullish crossover signal – a promising sign for buyers.
SPECIAL OFFER (Sponsored)
LIMITED OFFER 2024 for CryptoPotato readers at Bybit: Use this link to register and open a $500 BTC-USDT position on Bybit Exchange for free!
Disclaimer: Information found on CryptoPotato is those of writers quoted. It does not represent the opinions of CryptoPotato on whether to buy, sell, or hold any investments. You are advised to conduct your own research before making any investment decisions. Use provided information at your own risk. See Disclaimer for more information.
Cryptocurrency charts by TradingView.